Fig. 6
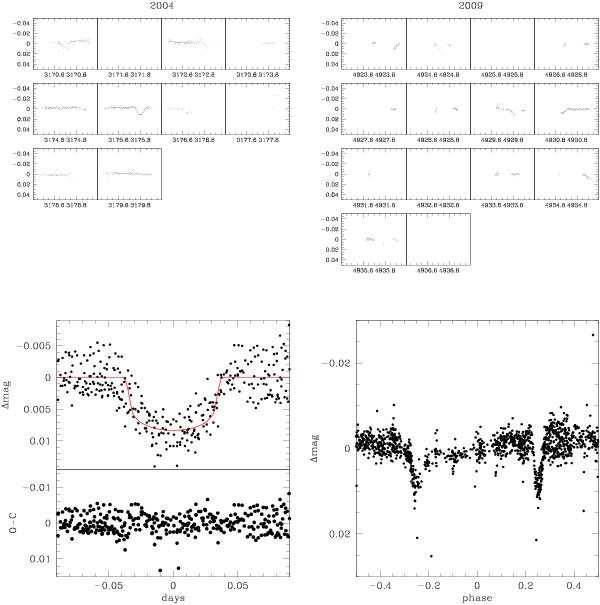
Upper left: lightcurve of star 56223 relative to the 2004 observing season. Upper right: lightcurve of star 56223 relative to the 2009 observing season. Lower left panel, upper figure: folded lightcurve. The continuous line indicates the best-fit model obtained using the Mandel & Algol (2002) algorithm, assuming that the host star is a solar type star. Lower left panel, bottom figure: observed minus model residuals. Lower right panel: lightcurve folded with a period twice the best fitting period, showing the possible presence of out-of-transit variations.
Current usage metrics show cumulative count of Article Views (full-text article views including HTML views, PDF and ePub downloads, according to the available data) and Abstracts Views on Vision4Press platform.
Data correspond to usage on the plateform after 2015. The current usage metrics is available 48-96 hours after online publication and is updated daily on week days.
Initial download of the metrics may take a while.