Fig. 5
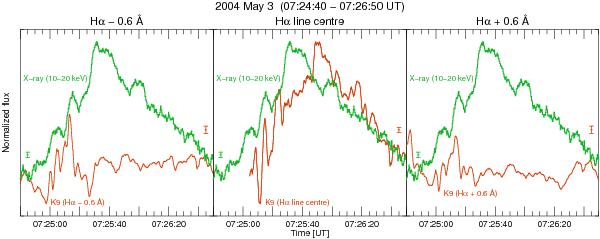
The RHESSI (10–20 keV) and LC-MSDP-SECIS Hα light curves of the K9 flaring kernel during the B2.5 flare on 2004 May 3. The Hα light curves are shown for line centre and ± 0.6 Å from the line centre. The data in the upper panel were smoothed using a 4-s box-car filter for the RHESSI light curve and a 1-s box-car filter for the Hα light curves. The RHESSI light curves in the bottom panel were smoothed using a 0.5-s box-car filter (thin curves) and a 4-s box-car filter (thick curves), while the Hα light curves shown are unsmoothed (thin curves) and smoothed using a 1-s box-car filter (thick curves). The vertical grey strips (labelled a–c) are shown magnified in the bottom panel. The error bars indicate the standard deviations calculated for Hα and X-ray light curves. The Hα and RHESSI HXR energy flux ranges are defined in Table 2.
Current usage metrics show cumulative count of Article Views (full-text article views including HTML views, PDF and ePub downloads, according to the available data) and Abstracts Views on Vision4Press platform.
Data correspond to usage on the plateform after 2015. The current usage metrics is available 48-96 hours after online publication and is updated daily on week days.
Initial download of the metrics may take a while.