Fig. 4
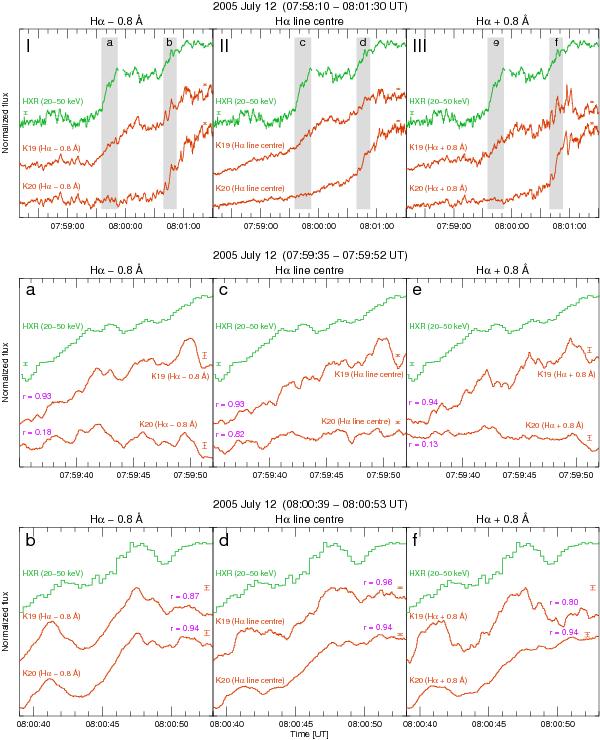
The RHESSI HXR (20–50 keV) and HT-MSDP-SECIS Hα light curves of the K19 and K20 flaring kernels recorded during the C8.3 on 2005 July 12. The Hα light curves are measured at line centre and ± 0.8 Å from the line centre and plotted using a linear scale. The RHESSI data are count rates (per second per detector) on a logarithmic scale. The integration times are 0.25 s for the demodulated HXR data, and 0.05 s for Hα data. The data were smoothed using a 1-s box-car filter for the HXR flux and 0.5-s box-car filter for the Hα light curves. The vertical grey strips in the upper panel (labelled a–f) are magnified in the middle and lower panels of this figure. The error bars indicate the standard deviations calculated for Hα and HXR light curves, except panels b, d, and f where the uncertainties in the HXR curves could not be easily established because of the RHESSI A1 attenuator insertion at 07:59:56 UT. The cross-correlation coefficients r (between HXR and Hα fluxes) are shown in panels a–f. All light curves are normalized to enhance the variations in intensity. The Hα and RHESSI HXR energy flux ranges are defined in Table 2.
Current usage metrics show cumulative count of Article Views (full-text article views including HTML views, PDF and ePub downloads, according to the available data) and Abstracts Views on Vision4Press platform.
Data correspond to usage on the plateform after 2015. The current usage metrics is available 48-96 hours after online publication and is updated daily on week days.
Initial download of the metrics may take a while.