| Issue |
A&A
Volume 534, October 2011
|
|
|---|---|---|
| Article Number | A57 | |
| Number of page(s) | 4 | |
| Section | Cosmology (including clusters of galaxies) | |
| DOI | https://doi.org/10.1051/0004-6361/201117820 | |
| Published online | 03 October 2011 | |
Research Note
An unlikely radio halo in the low X-ray luminosity galaxy cluster RXC J1514.9-1523
1
Department of Astronomy, University of Maryland, College Park, MD 20742-2421, USA
e-mail: This email address is being protected from spambots. You need JavaScript enabled to view it.
2
Joint Space-Science Institute, University of Maryland, College Park, MD 20742-2421, USA
3
INAF – Istituto di Radioastronomia, via Gobetti 101, 40129 Bologna, Italy
4
Department of Astronomy, University of Bologna, via Ranzani 1, 40127 Bologna, Italy
5
Astrophysics Science Division, Laboratory for High Energy Astrophysics, Code 662, NASA/Goddard Space Flight Center, Greenbelt, MD 20771, USA
6
Indian Institute of Science Education and Research, Central Tower, Sai Trinity Building, Sutarwadi Road, Pashan, Pune 411021, India
Received: 3 August 2011
Accepted: 13 September 2011
Abstract
We report the discovery of a giant radio halo in the galaxy cluster RXC J1514.9-1523 at z = 0.22 with a relatively low X-ray luminosity, LX[0.1−2.4 kev] ~ 7 × 1044 erg s-1. This faint, diffuse radio source is detected with the Giant Metrewave Radio Telescope at 327 MHz. The source is barely detected at 1.4 GHz in a NVSS pointing that we have reanalyzed. The integrated radio spectrum of the halo is quite steep, with a slope α = 1.6 between 327 MHz and 1.4 GHz. While giant radio halos are common in more X-ray luminous cluster mergers, there is a less than 10% probability to detect a halo in systems with LX ≲ 8 × 1044 erg s-1. The detection of a new giant halo in this borderline luminosity regime can be particularly useful for discriminating between the competing theories for the origin of ultrarelativistic electrons in clusters. Furthermore, if our steep radio spectral index is confirmed by future deeper radio observations, this cluster would provide another example of the recently discovered population of ultra-steep spectrum radio halos, predicted by the model in which the cluster cosmic ray electrons are produced by turbulent reacceleration.
Key words: radiation mechanisms: non-thermal / galaxies: clusters: general / galaxies: clusters: individual: RXC J1514.9-1523 / radio continuum: general
© ESO, 2011
1. Introduction
Hot, X-ray emitting gas is the dominant constituent of the intra-cluster medium (ICM) in galaxy clusters. The ICM is also permeated by magnetic fields and ultra-relativistic particles, whose energy densities and dynamical effects are still uncertain. The presence of these non-thermal components is evidenced by giant, faint synchrotron radio halos, detected in the central ~Mpc regions of a number of massive clusters (e.g., Ferrari et al. 2008; Cassano 2009; Venturi 2011, for reviews). Unlike radio galaxies, these diffuse, cluster-scale radio sources lack any optical identification and are associated directly with the ICM, in good spatial coincidence with the distribution of the hot, X-ray emitting gas. They are produced by electrons with Lorentz factor γ ≳ 1000 spinning in large-scale μG magnetic fields. Their radio spectra are steep, with spectral indices α > 1 (we adopt Sν ∝ ν − α, where Sν is the flux density at the frequency ν).
Observations show that radio halos are not common in galaxy clusters. Large halos are found in only ~ 1/3 of the most massive and X-ray luminous clusters (e.g., Giovannini et al. 1999; Kempner & Sarazin 2001; Venturi et al. 2008; Cassano et al. 2008), and become even rarer in less massive systems. The rest of the clusters seems to form a distinct population of radio-quiet systems (Brunetti et al. 2007, 2009).
Clusters with and without a giant halo appear segregated in terms of their dynamical state: halos are located exclusively in merging systems, while clusters without radio halos are typically more relaxed (e.g., Buote 2001; Cassano et al. 2010, and references therein). Few exceptions are known, where a merging system does not have a radio halo, typically with relatively low X-ray luminosity (LX ≲ 8 × 1044 erg s-1; e.g., Cassano et al. 2010; Russell et al. 2011).
The halo-merger connection suggests that the energy necessary to generate radio halos – through acceleration of particles and amplification of magnetic fields – is provided by cluster mergers. Although the origin of radio halos is still debated (e.g., Brunetti et al. 2008; Pfrommer et al. 2008; Donnert et al. 2010; Keshet & Loeb 2010; Brown & Rudnick 2011; Jeltema & Profumo 2011), current observations (e.g., Cassano 2009, and references therein) appear to favour models where the giant halos are caused by merger-driven turbulence that reaccelerates relativistic particles (reacceleration model; Petrosian 2001; Brunetti et al. 2001). In line with present data, these models predict that halos are more probably found in massive clusters and become quite rare in systems with mass ≲ 1015 M⊙ (i.e., LX ≲ 7 − 8 × 1044 erg s-1) at intermediate redshift (z ~ 0.2 ÷ 0.5; Cassano et al. 2008).
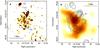 |
Fig. 1 a) GMRT full-resolution image at 327 MHz (contours and colors). The restoring beam is 14′′ × 12′′. Black contours start at +3σ = 0.36 mJy beam-1 and then scale by a factor of 2. The − 3σ level is shown as red, dashed contours. b) GMRT 327 MHz contours, after subtraction of S2 and S3 (panel a), overlaid on the smoothed RASS X-ray image. The restoring beam is 53′′ × 41′′ and the rms noise level is 0.27 mJy beam-1. Contours start at +3σ and then scale by a factor of 2. The − 3σ level is shown as black dashed contours. The cross shows the position of the cluster X-ray centre. |
Here, we report the discovery of a giant radio halo in RXC J1514.9-1523, a galaxy cluster at z = 0.22 with a relatively low X-ray luminousity, LX [0.1−2.4 kev] = 7.2 × 1044 erg s-1 (Böhringer et al. 2004).
We adopt the ΛCDM cosmology with H0 = 70 km s-1 Mpc-1, Ωm = 0.3 and ΩΛ = 0.7. At the redshift of RXC J1514.9-1523, this gives a scale of 1′′ = 3.59 kpc.
2. Radio observations
RXC J1514.9-1523 is in the cluster sample of the extended Giant Metrewave Radio Telescope (GMRT) Radio Halo Survey, an ongoing project to expand the existing sample of galaxy clusters (Venturi et al. 2007, 2008; see Cassano et al. 2010, for details). In this work, we analyze archival GMRT observations of RXC J1514.9-1523 at 327 MHz and Very Large Array (VLA) data at 1.4 GHz from the NVSS1 pointing containing the cluster, that we have reprocessed. We also observed the cluster with the GMRT at 235 MHz/610 MHz in August 2009, as part of the extended GMRT Radio Halo Survey. Variable radio frequency interference was present for the whole observation, particularly on the shortest spacings. The subsequent editing left a sparse sampling at the short baselines, preventing the production of an image of the radio halo of any use. A reobservation is currently planned.
2.1. GMRT observations at 327 MHz
RXC J1514.9-1523 was observed with the GMRT at 327 MHz in April 2004 as part of the GMRT Cluster Key Project (05VKK01), for a total of ~140 min on source. The data were recorded using both the upper and lower side bands (USB and LSB), providing a total observing bandwidth of 32 MHz. The default spectral-line mode was used. The USB and LSB datasets were calibrated individually using the NRAO Astronomical Image Processing System (AIPS) package, following the procedure described in Giacintucci et al. (2008). After bandpass calibration and a priori amplitude calibration, a number of phase-only self-calibration cycles and imaging were carried out for each data set. We initially self-calibrated the longest baselines using only the point sources in the field, then we progressively included short baselines and resolved radio sources. Finally, we included also the emission from the radio halo. Wide-field imaging was implemented in each step of the data reduction. We used 25 facets to cover a total field of ~2.7° × 2.7°. The USB and LSB data sets were then combined together to produce the final images using the multi-scale CLEAN implemented in IMAGR, which allows better imaging of extended sources compared to the traditional CLEAN (e.g., Clarke & Ensslin 2006; for a detailed discussion see Appendix A in Greisen et al. 2009). We used delta functions as model components for the unresolved features and circular Gaussians for the resolved ones, with increasing width to progressively highlight the extended emission during the clean. The rms sensitivity levels achieved in the image at full resolution (~14′′) is ~120 μJy beam-1. We also produced images with lower resolutions, down to ~50′′, by tapering the uv data using UVTAPER and ROBUST in IMAGR. The noise reached in the images at the lowest resolution is ~0.3 mJy beam-1.
The flux density scale was set using the scale of Baars et al. (1977). The average residual amplitude errors are ≲ 8% (e.g., Chandra et al. 2004).
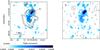 |
Fig. 2 a) GMRT 327 MHz contours of the radio halo (black and white; same as Fig. 1b), overlaid on the VLA 1.4 GHz image at the resolution of 42′′ × 37′′, obtained from the re-processed NVSS data. The rms noise in the 1.4 GHz image is 0.25 mJy beam-1. Point sources, derived from an image produced with only baselines ≥ 2 kλ, have been subtracted out at 1.4 GHz. b) Same re-processed NVSS image as panel a), with 1.4 GHz contours overlaid at levels − 0.5 (dashed black), 0.5, 0.75 and 1 (white) mJy beam-1. |
Figure 1a presents the 327 MHz image of the ~12 × 12 arcmin2 field containing RXC J1514.9–1523 at full resolution (~14′′). The field corresponds to an area of ~2.6 × 2.6 Mpc2 at the redshift of the cluster. The cross shows the position of the cluster X-ray centre, as reported in the REFLEX2 cluster catalogue (RA = 15h14m58.0s, Dec = − 15°23′10′′). The brightest sources in the cluster region, S1 and S3, are both extended with tailed morphology. S2, south of the cluster centre, is unresolved. Faint, diffuse emission is observed in the region between the head-tail S1 and S2. Figure 1b shows the 327 MHz image restored with a beam of 53′′ × 41′′, after subtraction of the clean components associated with all individual radio sources in the cluster area but S1. The radio contours are superposed on the smoothed ROSAT All-Sky-Survey (RASS) X-ray image. The image confirms the existence of large radio halo at the cluster centre, with a size of ~1.4 Mpc and a fairly roundish morphology. The halo covers a large part of the complex X-ray emission associated with the cluster, which is mostly elongated in the northeast-southwest direction, with two possible peaks, probably due to an ongoing cluster merger. The brightest portion of the halo is approximately coincident with the main X-ray peak.
In Fig. 2a, we overlay the 327 MHz contours of the radio halo on the NVSS VLA image at 1.4 GHz at the resolution of 42′′ × 37′′, also shown as contours in Fig. 2b. The 1.4 GHz image has been obtained after new calibration of the NVSS pointing containing RXC J1514.9-1523. While only hints of the radio halo were barely visible on the public NVSS image, the new data calibration, joint with phase self-calibration, allowed us to obtain an image of the diffuse source. We first used only baselines longer than 2 kλ to image the discrete radio sources. The clean components associated with these sources were then subtracted from the uv-data, and the resulting data set was used to obtain the image in Fig. 2.
The radio halo is quite faint at 1.4 GHz; only the central, bright region of the emission seen at 327 MHz is detected in the reprocessed NVSS image, at a level starting from ~0.5 mJy beam-1 with a peak of ~1.2 mJy beam-1.
The flux density of the halo at 327 MHz is 102 ± 9 mJy. This was obtained by integration of the low-resolution image in Fig. 1b over the area that encompasses the whole diffuse emission, and after subtraction of the contribution of S1, measured at full resolution (81 ± 6 mJy). The flux density at 1.4 GHz is 10 ± 2 mJy (after subtraction of 38 ± 2 mJy associated with S1). The resulting spectral index of the halo is α = 1.6 ± 0.2. This value is the average over the whole halo extent at 327 MHz, but the size of the emission detected in the NVSS pointing is considerably smaller and part of the halo flux density may be missed. Deeper and higher resolution observations at 1.4 GHz are therefore needed to accurately measure the total flux density of the halo and place a better constraint on its spectral index.
3. Discussion
The 327 MHz images presented in Sect. 3 show that RXC J1514.9-1523 possesses a large, central radio halo. The diffuse source is brighter and larger at 327 MHz than in the reprocessed NVSS image at 1.4 GHz, where the halo is only marginally visible.
With an X-ray luminosity of LX [0.1 − 2.4 kev] = 7.2 × 1044 erg s-1, RXC J1514.9-1523 is one of the faintest systems among the radio halo clusters at redshift larger than 0.2 (e.g., Brunetti et al. 2009). Based on the GMRT Radio Halo Survey at 610 MHz, coupled with literature information, Cassano et al. (2008) established that the fraction of radio halo clusters in highly massive systems (i.e., with LX > 8 × 1044 erg s-1) is ~1/3, while the occurrance of halos in less X-ray luminous clusters is less than 10% at intermediate redshifts (z ~ 0.2 ÷ 0.5). Therefore, the detection of a giant halo in a relatively low X-ray luminousity cluster at z > 0.2, such as RXC J1514.9-1523, adds important information to the statistics of halos in such systems.
The decrease of the fraction of radio-halo clusters with decreasing mass and X-ray luminosity of the cluster is a prediction of turbulent reacceleration models, which expect mergers between massive clusters ( ≳1−2 × 10¹⁵ M⊙) to be more efficient accelerators of relativistic particles (Cassano & Brunetti 2005; Cassano et al. 2006). In these models, the synchrotron spectra of radio halos should have a spectral break at a frequency which depends on the fraction of turbulence energy converted into electron reacceleration. Only collisions between massive clusters with similar-mass subclusters are able to generate radio halos with a break frequency ≥ 1 GHz. The formation of this type of halos in clusters with lower masses, or during moderately energetic mergers, is more difficult and rare. Here, less efficient reacceleration may result in halos with a spectral break at frequencies lower than 1 GHz. Such halos would be barely detectable at ~1 GHz, but bright at lower frequencies, and should have an extremely steep spectrum when observed at GHz frequencies.
Interestingly, most of the unrelaxed clusters without detected radio halo have LX ≲ 8 × 1044 erg s-1 (e.g., Cassano et al. 2010a; Russell et al. 2011). These outliers may be detected in the radio band by future observations at lower frequencies, for instance with the LOw Frequency ARray (LOFAR) and Long Wavelength Array (LWA). In one of these systems, A 781, large-scale residual emission at 325 MHz has been recently reported by Venturi et al. (2011), which might indeed trace an underlying halo with very steep spectrum (but see Govoni et al. 2011).
The detection of halos with very steep spectra (α > 1.5) disfavours a secondary origin of the radio emitting electrons for energy reasons (Brunetti 2004; Pfrommer & Ennslin 2004). In hadronic models, clusters hosting halos with very steep spectrum contain an untenable large population of cosmic ray protons (e.g., Brunetti et al. 2008; Macario et al. 2010), while a much smaller energy is constrained by present upper limits in the gamma-ray band (Aharonian et al. 2009; Ackermann et al. 2010; Jeltema & Profumo 2011). If the steep radio spectral index (α = 1.6) of the halo is confirmed by future deeper observations, RXC J1514.9-1523 would provide another example of an ultra-steep spectrum radio halo. Interestingly, RXC J1514.9-1523 shares similar properties with the prototype of this population of halos, A 521 (Brunetti et al. 2008; Dallacasa et al. 2009). The X-ray luminosity of the two clusters is almost identical, and so are the radio powers of the halos with logP1.4 GHz(W Hz-1) = 24.23 and 24.18, respectively. Indeed, the two clusters occupy the same region in the radio-X-ray luminosity diagram for giant radio halos (e.g., Brunetti et al. 2009). In particular, as A 521, RXC J1514.9-1523 appears slightly underluminous in the radio band with respect to the P1.4 GHz − LX correlation for halos, possibly due to its steep spectrum.
4. Conclusions
Using GMRT data at 327 MHz, we found a Mpc-size radio halo in the galaxy cluster RXC J1514.9-1523. With an X-ray luminosity of ~7 × 1044 erg s-1, this cluster is one of the less X-ray luminous systems with a radio halo at z > 0.2. Observations show that the percentage of clusters with a halo decreases with decreasing cluster mass. In particular, giant halos are found only in less than 10% of clusters with LX ≲ 8 × 1044 erg s-1. A drop of
the fraction of clusters with giant halos is expected at these X-ray luminosities in the context of turbulent reacceleration models. The discovery of a giant halo in a cluster in this borderline X-ray luminosity regime adds therefore a useful piece to the puzzle of the origin of radio halos, as it adds information to the statistics of halos in an important range of cluster masses. In addition, if the steep spectrum of the halo is confirmed by future radio observations, RXC J1514.9-1523 will also provide crucial support to reacceleration models and contribute to answer the long standing question of the origin of cluster-wide radio halos.
NRAO VLA Sky Survey (Condon et al. 1998).
ROSAT-ESO Flux Limited X-ray (Böhringer et al. 2004).
Acknowledgments
We thank the staff of the GMRT for their help during the observations. GMRT is run by the National Centre for Radio Astrophysics of the Tata Institute of Fundamental Research. S.G. acknowledges the support of NASA through Einstein Postdoctoral Fellowship PF0-110071 awarded by the Chandra X-ray Center (CXC), which is operated by SAO. The National Radio Astronomy Observatory is a facility of the National Science Foundation operated under cooperative agreement by Associated Universities, Inc.
References
- Ackermann, M., et al. 2010, ApJ, 717, L7 [Google Scholar]
- Aharonian, F., Akhperjanian, A. G., Anton, G., et al. 2009, A&A, 502, 437 [NASA ADS] [CrossRef] [EDP Sciences] [Google Scholar]
- Baars, J. W. M., Genzel, R., Pauliny-Toth, I. I. K., & Witzel, A. 1977, A&A, 61, 99 [NASA ADS] [Google Scholar]
- Böhringer, H., Schuecker, P., Guzzo, L., et al. 2004, A&A, 425, 367 [NASA ADS] [CrossRef] [EDP Sciences] [Google Scholar]
- Brown, S., & Rudnick, L. 2011, MNRAS, 412, 2 [NASA ADS] [CrossRef] [Google Scholar]
- Brunetti, G. 2004, J. Kor. Astron. Soc., 37, 493 [Google Scholar]
- Brunetti, G., Setti, G., Feretti, L., & Giovannini, G. 2001, MNRAS, 320, 365 [NASA ADS] [CrossRef] [Google Scholar]
- Brunetti, G., Venturi, T., Dallacasa, D., et al. 2007, ApJ, 670, L5 [NASA ADS] [CrossRef] [Google Scholar]
- Brunetti, G., Giacintucci, S., Cassano, R., et al. 2008, Nature, 455, 944 [NASA ADS] [CrossRef] [Google Scholar]
- Brunetti, G., Cassano, R., Dolag, K., & Setti, G. 2009, A&A, 507, 661 [NASA ADS] [CrossRef] [EDP Sciences] [Google Scholar]
- Buote, D. A. 2001, ApJ, 553, L15 [NASA ADS] [CrossRef] [Google Scholar]
- Cassano, R. 2009, The Low-Frequency Radio Universe, 407, 223 [Google Scholar]
- Cassano, R., & Brunetti, G. 2005, MNRAS, 357, 1313 [NASA ADS] [CrossRef] [Google Scholar]
- Cassano, R., Brunetti, G., & Setti, G. 2006, MNRAS, 369, 1577 [NASA ADS] [CrossRef] [Google Scholar]
- Cassano, R., Brunetti, G., Venturi, T., et al. 2008, A&A, 480, 687 [NASA ADS] [CrossRef] [EDP Sciences] [Google Scholar]
- Cassano, R., Ettori, S., Giacintucci, S., et al. 2010, ApJ, 721, L82 [NASA ADS] [CrossRef] [Google Scholar]
- Chandra, P., Ray, A., & Bhatnagar, S. 2004, ApJ, 612, 974 [NASA ADS] [CrossRef] [Google Scholar]
- Clarke, T. E., & Ensslin, T. A. 2006, AJ, 131, 2900 [Google Scholar]
- Condon, J. J., Cotton, W. D., Greisen, E. W., et al. 1998, AJ, 115, 1693 [NASA ADS] [CrossRef] [Google Scholar]
- Dallacasa, D., Brunetti, G., Giacintucci, S., et al. 2009, ApJ, 699, 1288 [NASA ADS] [CrossRef] [Google Scholar]
- Donnert, J., Dolag, K., Cassano, R., & Brunetti, G. 2010, MNRAS, 407, 1565 [NASA ADS] [CrossRef] [Google Scholar]
- Ferrari, C., Govoni, F., Schindler, S., Bykov, A. M., & Rephaeli, Y. 2008, SSRv, 134, 93 [Google Scholar]
- Giacintucci, S., Venturi, T., Macario, G., et al. 2008, A&A, 486, 347 [NASA ADS] [CrossRef] [EDP Sciences] [Google Scholar]
- Giovannini, G., Tordi, M., & Feretti, L. 1999, NewA, 4, 141 [Google Scholar]
- Govoni, F., Murgia, M., Giovannini, G., Vacca, V., & Bonafede, A. 2011, A&A, 529, A69 [NASA ADS] [CrossRef] [EDP Sciences] [Google Scholar]
- Greisen, E. W., Spekkens, K., & van Moorsel, G. A. 2009, AJ, 137, 4718 [NASA ADS] [CrossRef] [Google Scholar]
- Jeltema, T. E., & Profumo, S. 2011, ApJ, 728, 53 [NASA ADS] [CrossRef] [Google Scholar]
- Kempner, J. C., & Sarazin, C. L. 2001, ApJ, 548, 639 [NASA ADS] [CrossRef] [Google Scholar]
- Keshet, U., & Loeb, A. 2010, ApJ, 722, 737 [NASA ADS] [CrossRef] [Google Scholar]
- Macario, G., Venturi, T., Brunetti, G., et al. 2010, A&A, 517, A43 [NASA ADS] [CrossRef] [EDP Sciences] [Google Scholar]
- Petrosian, V. 2001, ApJ, 557, 560 [NASA ADS] [CrossRef] [Google Scholar]
- Pfrommer, C., & Enßlin, T. A. 2004, J. Kor. Astron. Soc., 37, 455 [Google Scholar]
- Pfrommer, C., Enßlin, T. A., & Springel, V. 2008, MNRAS, 385, 1211 [NASA ADS] [CrossRef] [Google Scholar]
- Russell, H. R., van Weeren, R. J., Edge, A. C., et al. 2011, MNRAS, in press [arXiv:1105.0435] [Google Scholar]
- Venturi, T. 2011, [arXiv:1102.1572] [Google Scholar]
- Venturi, T., Giacintucci, S., Brunetti, G., et al. 2007, A&A, 463, 937 [NASA ADS] [CrossRef] [EDP Sciences] [Google Scholar]
- Venturi, T., Giacintucci, S., Dallacasa, D., et al. 2008, A&A, 484, 327 [NASA ADS] [CrossRef] [EDP Sciences] [Google Scholar]
- Venturi, T., Giacintucci, G., Dallacasa, D., et al. 2011, MNRAS, 414, L65 [NASA ADS] [CrossRef] [Google Scholar]
All Figures
|
Fig. 1 a) GMRT full-resolution image at 327 MHz (contours and colors). The restoring beam is 14′′ × 12′′. Black contours start at +3σ = 0.36 mJy beam-1 and then scale by a factor of 2. The − 3σ level is shown as red, dashed contours. b) GMRT 327 MHz contours, after subtraction of S2 and S3 (panel a), overlaid on the smoothed RASS X-ray image. The restoring beam is 53′′ × 41′′ and the rms noise level is 0.27 mJy beam-1. Contours start at +3σ and then scale by a factor of 2. The − 3σ level is shown as black dashed contours. The cross shows the position of the cluster X-ray centre. |
| In the text | |
|
Fig. 2 a) GMRT 327 MHz contours of the radio halo (black and white; same as Fig. 1b), overlaid on the VLA 1.4 GHz image at the resolution of 42′′ × 37′′, obtained from the re-processed NVSS data. The rms noise in the 1.4 GHz image is 0.25 mJy beam-1. Point sources, derived from an image produced with only baselines ≥ 2 kλ, have been subtracted out at 1.4 GHz. b) Same re-processed NVSS image as panel a), with 1.4 GHz contours overlaid at levels − 0.5 (dashed black), 0.5, 0.75 and 1 (white) mJy beam-1. |
| In the text | |
Current usage metrics show cumulative count of Article Views (full-text article views including HTML views, PDF and ePub downloads, according to the available data) and Abstracts Views on Vision4Press platform.
Data correspond to usage on the plateform after 2015. The current usage metrics is available 48-96 hours after online publication and is updated daily on week days.
Initial download of the metrics may take a while.