Fig. 3
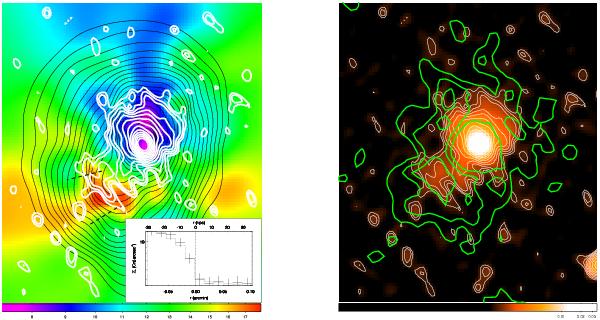
Left: XMM-Newton X-ray temperature map of RX J1347 in keV. X-ray iso-contours from the Chandra [0.5, 2.5] keV band image are superimposed in black. Total intensity radio contours are overlaid in white. They start at 3σ level and are spaced by a factor of  . The inset shows the ICM brightness profile corresponding to the sector illustrated by the dashed lines on the main image. A shock model corresponding to density and temperature jumps of
  and
and  gives the fitted brightness profile indicated by dotted lines in the inset. Right: total intensity 614 MHz map and contours (white) of RX J1347. Contours of the MUSTANG SZE image of the cluster are overlaid in green (levels: −1.5, −1.0 and −0.5 mJy/beam, from the inner contour outward, as in Mason et al. 2010, Fig. 6). The two panels have exactly the same physical scale.
Current usage metrics show cumulative count of Article Views (full-text article views including HTML views, PDF and ePub downloads, according to the available data) and Abstracts Views on Vision4Press platform.
Data correspond to usage on the plateform after 2015. The current usage metrics is available 48-96 hours after online publication and is updated daily on week days.
Initial download of the metrics may take a while.