Fig. 3
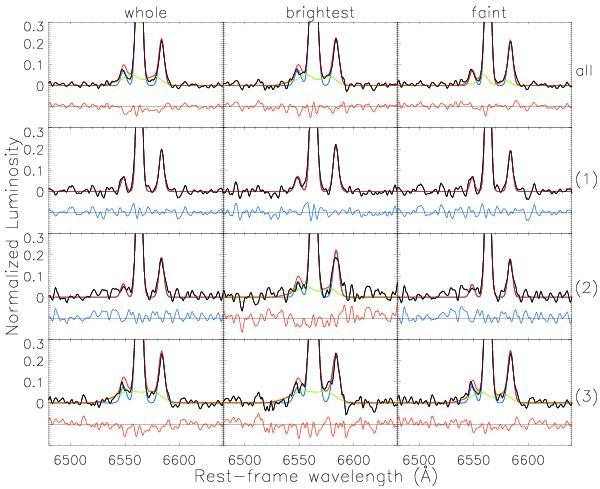
Zoom of the region of Hα and [Nii] for 12 different stacks (black lines). From left to right: the integrated spectrum of all the emission from each galaxy (whole), only the brightest 18 pixels in Hα (brightest), and all other pixels (faint); from top to bottom: all spectral bins, bins (1), (2), and (3). The dashed blue line is the best fit to the strongest component of each line, the green dashed line the fit to the weaker offset component, and the red line is the total of the fitted lines (see text for details). For each stack we show the residuals to the fit underneath each spectrum (in blue for stacks that do not require a broad component and in red for those that do). Velocity offsets range from ~ 100 − 500 km s-1 with the highest value seen in the stack with the highest average surface brightness.
Current usage metrics show cumulative count of Article Views (full-text article views including HTML views, PDF and ePub downloads, according to the available data) and Abstracts Views on Vision4Press platform.
Data correspond to usage on the plateform after 2015. The current usage metrics is available 48-96 hours after online publication and is updated daily on week days.
Initial download of the metrics may take a while.