Fig. 2
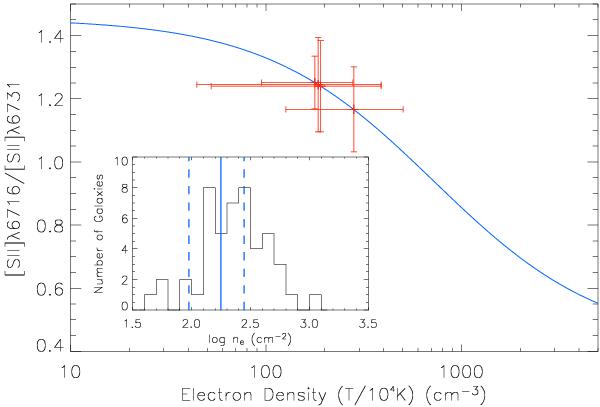
[Sii]λ6716/[Sii]λ6731 line flux ratio as a function of electron density (cm-3), for a temperature of 104 K (blue line). Only results for the stacks of the brightest pixels of Hα emission are indicated (red crosses). The error bars indicate the 1σ uncertainties in the measurements. For clarity, stacks with [Sii] line ratios below the low-density limit are not shown. The inset at the lower left shows the distribution of electron densities ne in the nuclear region of nearby starburst galaxies (Lehnert & Heckman 1996), as well as the mean electron density for the stack, including only the brightest pixels of all our objects (solid blue line) and the corresponding ± 1σ uncertainties (dashed blue lines).
Current usage metrics show cumulative count of Article Views (full-text article views including HTML views, PDF and ePub downloads, according to the available data) and Abstracts Views on Vision4Press platform.
Data correspond to usage on the plateform after 2015. The current usage metrics is available 48-96 hours after online publication and is updated daily on week days.
Initial download of the metrics may take a while.