Fig. 4
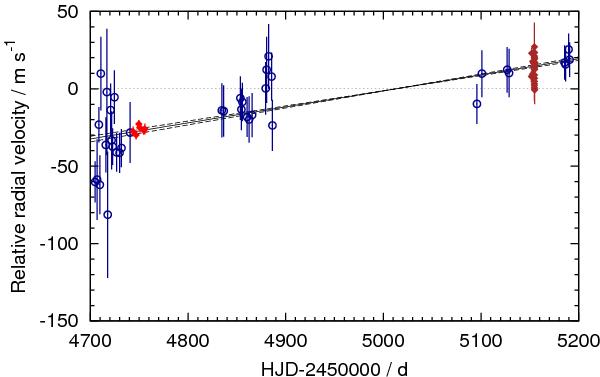
Radial velocities of WASP-22 showing a linear drift in the systemic velocity of  m s-1 yr-1. The colour and symbol key is the same as in Fig. 1. The Keplerian orbit of Table 3 was subtracted. The value of
  from Table 3 is plotted as a solid line, relative to JD = 2 455 013, which is the centre-of-mass of the RV data, weighted by the square of the measurement precision. The drift’s 1-σ error bars are plotted as dashed lines.
Current usage metrics show cumulative count of Article Views (full-text article views including HTML views, PDF and ePub downloads, according to the available data) and Abstracts Views on Vision4Press platform.
Data correspond to usage on the plateform after 2015. The current usage metrics is available 48-96 hours after online publication and is updated daily on week days.
Initial download of the metrics may take a while.