Fig. 1
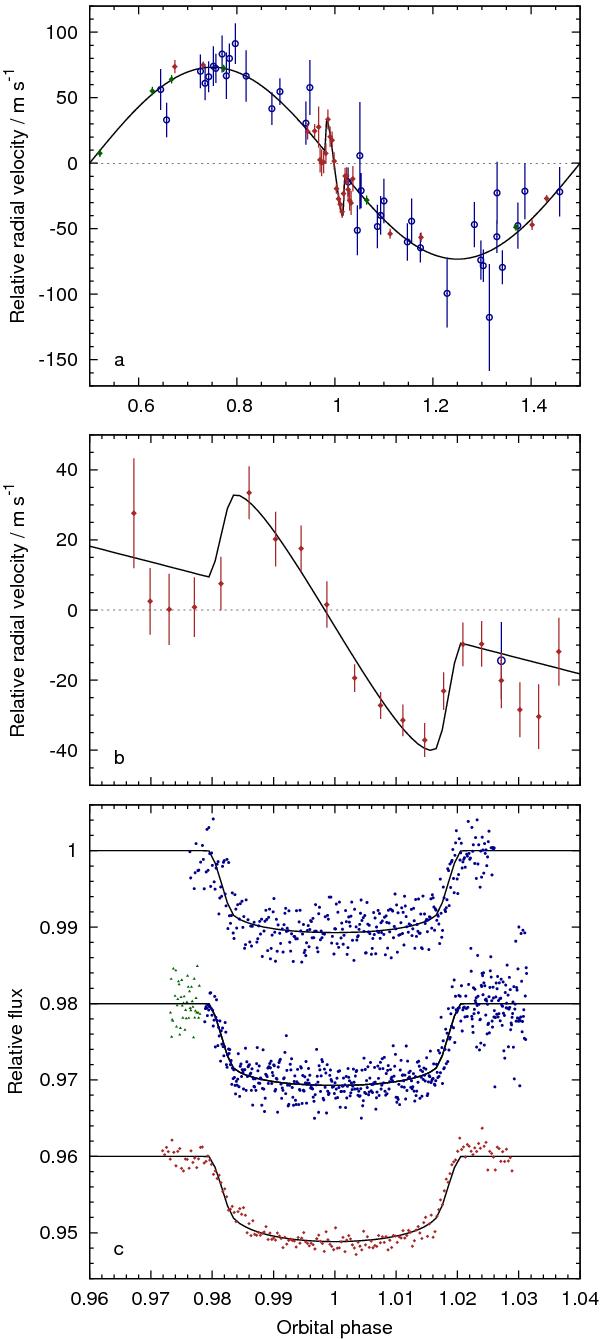
a) The CORALIE (blue circles) and HARPS (green diamonds) RVs of WASP-22 from M10, and the HARPS RVs from this paper (brown diamonds). b) An expansion of the region around the spectroscopic transit, as measured by HARPS on 2009 Nov. 19. c) The transit light curves, from top to bottom, obtained by TRAPPIST on 2010 Nov. 18 and 2010 Dec. 2 through an I+z filter and by EulerCam on 2010 Dec. 2 through a Gunn r filter. The data obtained by TRAPPIST on 2010 Dec. 2 prior to the meridian flip are denoted by green triangles and blue dots denote the data obtained post-flip. In each panel, the data are phase-folded on the ephemeris given in Table 3 and the best-fitting models of Sect. 3 are superimposed.
Current usage metrics show cumulative count of Article Views (full-text article views including HTML views, PDF and ePub downloads, according to the available data) and Abstracts Views on Vision4Press platform.
Data correspond to usage on the plateform after 2015. The current usage metrics is available 48-96 hours after online publication and is updated daily on week days.
Initial download of the metrics may take a while.