Fig. 3
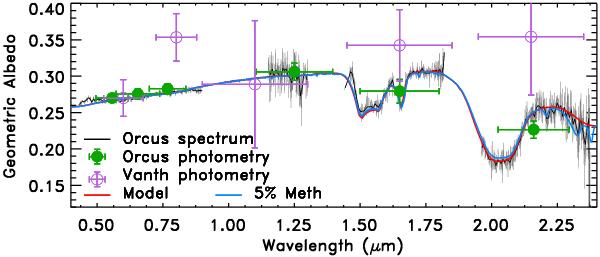
Plotted here is the average spectrum of Orcus from our work and Barucci et al. together with the visible data from DeMeo et al. (2009), scaled to the visible albedo estimated by Lim et al. (2010). Overplotted are the basic model in red (#1 in Table 1) and model with additional 5% methane in blue (#2, ibid). Also shown in purple are the visible and near-infrared colors of Vanth. The V, I, and J band measurements are from Brown et al. (2010). The colors of Vanth are normalized to Orcus’ spectrum at 0.6 microns.
Current usage metrics show cumulative count of Article Views (full-text article views including HTML views, PDF and ePub downloads, according to the available data) and Abstracts Views on Vision4Press platform.
Data correspond to usage on the plateform after 2015. The current usage metrics is available 48-96 hours after online publication and is updated daily on week days.
Initial download of the metrics may take a while.