| Issue |
A&A
Volume 534, October 2011
|
|
|---|---|---|
| Article Number | A59 | |
| Number of page(s) | 9 | |
| Section | Extragalactic astronomy | |
| DOI | https://doi.org/10.1051/0004-6361/201117467 | |
| Published online | 03 October 2011 | |
The optical variability of steep-spectrum radio quasars in the SDSS stripe 82 region
1
Key Laboratory for Research in Galaxies and Cosmology, Shanghai Astronomical Observatory, Chinese Academy of Sciences, 80 Nandan Road, Shanghai 200030, PR China
e-mail: This email address is being protected from spambots. You need JavaScript enabled to view it.
2
National Astronomical Observatories/Yunnan Observatory, Chinese Academy of Sciences, PO Box 110, 650011 Kunming, Yunnan, PR China
3
Key Laboratory for the Structure and Evolution of Celestial Objects, Chinese Academy of Sciences, PO Box 110, 650011 Kunming, Yunnan, PR China
Received: 13 June 2011
Accepted: 2 August 2011
Abstract
Context. There have been many investigations of the optical variability of flat-spectrum radio quasars (FSRQs), but the optical variability of steep-spectrum radio quasars (SSRQs) has been poorly studied.
Aims. We investigate the optical variability of SSRQs, comparing this with the optical variability of FSRQs.
Methods. We measure the optical variability of 18 SSRQs and 15 FSRQs in the SDSS Stripe 82 region using SDSS DR7 released multi-epoch data covering about nine years. We determine the spectral index by fitting a power law to SDSS ugriz photometric data, and explore the relationship between this spectral index and source brightness.
Results. For all SSRQs studied, we detect variations in r band flux of overall amplitude between 0.22 mag and 0.92 mag in different sources. Eight of 18 SSRQs display a bluer-when-brighter (BWB) trend. In contrast, the variability amplitude of 15 FSRQs in r band ranges from 0.18 to 0.97 mag, and 11 of 15 sources follow a BWB trend. For all SSRQs studied, we found an anti-correlation between the Eddington ratio and the variability amplitude in r band, which is similar to that in radio-quiet AGNs. This implies that the thermal emission from the accretion disk may be responsible for the variability in SSRQs, although the jet nonthermal emission cannot be excluded. In contrast, there is no correlation found for FSRQs, which implies that the mechanisms of variability in FSRQs may be different from that in SSRQs. The optical continuum variability of radio-loud broad absorption-line quasars (BALQs) are investigated for the first time here for two sources with steep radio spectra. Both radio-loud BALQs display variations with amplitudes of about 0.3 mag at r band. Their spectral variability all follow a BWB trend. In our previous analysis of a combined sample of 18 SSRQs and 44 FSRQs, we found that the line width of the broad Mg II emission line is broader for steeper radio spectral indices. It implies a disk-like broad line region (BLR) geometry may present in these quasars. In these 62 quasars, we found a ~57% source percentage showing BWB trend in FSRQs, whereas it is ~44% in SSRQs.
Key words: galaxies: photometry / quasars: general / galaxies: active
© ESO, 2011
1. Introduction
Active galactic nuclei (AGNs) exhibit variability at almost all wavelengths (e.g., Wiita 1996). Multiwavelength studies of variations in the radiation emitted from AGNs have played important roles in exploring the physical conditions near the center of AGNs. On the basis of variability, the reverberation mapping method was developed to calculate the size of the broad-line region (BLR). In the photoionization model, the flux variations of BLR follows the flux variation of continuum ionization emission with a certain time lag, which corresponds to the size of the BLR (Peterson 1993). Moreover, the disk-jet connections can be investigated by using the long-term multiwavelength variability monitorings (e.g., Chatterjee et al. 2009, 2011).
Intrinsically, the variations in the brightnesses of AGNs are generally caused by physical variations in the jet and accretion disk. However, the contribution of each component to the observed variability varies from source to source. Blazars, including BL Lac objects and flat-spectrum radio quasars (FSRQs), are the most extreme class of AGNs, characterized by strong and rapid variability, high polarization, and apparent superluminal motion. These extreme properties are generally interpreted as a consequence of non-thermal emission from a relativistic jet oriented close to the line of sight. In general, the variations in blazars are dominated by the jet emission. There have been extensive studies of the optical variability of blazars (e.g., Ghisellini et al. 1997; Fan et al. 1998; Massaro et al. 1998; Ghosh et al. 2000; Clements & Carini 2001; Raiteri et al. 2001; Villata et al. 2002; Vagnetti et al. 2003; Wu et al. 2005, 2007; Gu et al. 2006; Hu et al. 2006; Poon et al. 2009; Rani et al. 2010; Gu & Ai 2011). While it is generally accepted that the nonthermal emission from relativistic jet oriented close to the line of sight dominates the optical continuum, the situation seems more complicated in FSRQs. It is unclear whether the nonthermal jet emission is chiefly responsible for the optical variability. Evidence of thermal emission in FSRQs has been detected in several cases usually during low-activity states (e.g., 3C 279, Pian et al. 1999; 3C 273, Grandi & Palumbo 2004; 3C 454.3, Raiteri et al. 2007). D’Ammando et al. (2011) shows that the optical variability in the FSRQ PKS 1510-089 is mainly due to the thermal emission, and only during major flares can a contribution from the jet be seen. Moreover, the redder-when-brighter trend found in several FSRQs implies that the thermal emission plays an important role in the optical variability (e.g., Gu et al. 2006; Rani et al. 2010; Gu & Ai 2011; Wu et al. 2011).
Both the long-term or short-term variabilities of radio-quiet AGNs have also been explored (e.g., Stalin et al. 2004, 2005; Gupta & Joshi 2005; Ai et al. 2010). The accretion disk instabilities might explain the optical microvariability of radio quiet AGNs (e.g., Gopal-Krishna et al. 1995; see also Gopal-Krishna et al. 2003, for alternative scenario). In terms of the long-term variability, the change in accretion rate is used to explain the optical variations in radio quiet AGNs (e.g., Li & Cao 2008). The properties of steep-spectrum radio quasars (SSRQs) are in-between those of both FSRQs and radio-quiet quasars. The SSRQs are usually lobe-dominated radio quasars, and the radio lobe emission dominates over the radio core emission. Their jets are viewed at larger angles than blazars, hence, the beaming effects of jets should not be severe (see e.g., Liu et al. 2006), and the jet emission is not expected to dominate at optical bands (e.g., Gu & Ai 2011). However, the variations in SSRQs might still be caused by a mixture of a jet and accretion disk, since they are powerful radio emitters. The optical variations of SSRQs have been poorly studied, and few explanations have been presented (e.g., Stalin et al. 2004, 2005). While the color variations and/or spectral variations of blazars have been extensively investigated (e.g., Ghisellini et al. 1997; Fan et al. 1998; Massaro et al. 1998; Ghosh et al. 2000; Clements & Carini 2001; Raiteri et al. 2001; Villata et al. 2002; Vagnetti et al. 2003; Wu et al. 2005, 2007; Gu et al. 2006; Rani et al. 2010; Gu & Ai 2011), it has not been the case for SSRQs. In this work, we investigate the optical variability of a sample of SSRQs, as well as their spectral variations.
The layout of this paper is as follows: in Sect. 2, we describe the source sample; the variability results are outlined in Sect. 3; Sect. 4 includes the discussion; and in the last section, we draw our conclusions. The cosmological parameters H0 = 70 km s-1 Mpc-1, Ωm = 0.3, and ΩΛ = 0.7 are used throughout the paper, and the spectral index α is defined as fν ∝ ν − α, where fν is the flux density at frequency ν.
2. Sample selection
2.1. Quasars in Stripe 82 region
Our initial quasar sample was selected as those quasars in both the SDSS DR7 quasar catalogue (Schneider et al. 2010) and Stripe 82 region. The SDSS DR7 quasar catalogue consists of 105 783 spectroscopically confirmed quasars with luminosities brighter than Mi = −22.0, with at least one emission line having a full width at half-maximum (FWHM) larger than 1000 km s-1 and highly reliable redshifts. The sky coverage of the sample is about 9380 deg2 and the redshifts range from 0.065 to 5.46. The five-band (u, g, r, i, z) magnitudes have typical errors of about 0.03 mag. The spectra cover the wavelength range from 3800 Å to 9200 Å with a resolution of ≃ 2000 (see Schneider et al. 2010, for details). The Stripe 82 region, i.e., right ascension α = 20h − 4h and declination 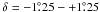 , was repeatedly scanned during the SDSS-I phase (2000−2005) under generally photometric conditions, and the data are well-calibrated (Lupton et al. 2002). This region was also scanned repeatedly over the course of three 3-month campaigns in three successive years in 2005−2007, as part of the SDSS Supernova Survey (SN survey). The multi-epoch photometric observations therefore enable us to investigate the optical variability of the selected quasars.
2.2. Cross-correlation with radio catalogues
We define a quasar to be a SSRQ according to its radio spectral index. Therefore, we cross-correlate the initial quasar sample with the Faint Images of the Radio Sky at Twenty centimeters (FIRST) 1.4-GHz radio catalogue (Becker et al. 1995), the Green Bank 6-cm (GB6) survey at 4.85 GHz radio catalogue (Gregory et al. 1996), and the Parkes-MIT-NRAO (PMN) radio continuum survey at 4.85 GHz (Griffith & Wright 1993), as well as for sources with δ < 0°. The FIRST survey used the Very Large Array (VLA) to observe the sky at 20 cm (1.4 GHz) with a beam size of 5.4 arcsec. The survey was designed to cover the same region of the sky as the SDSS, and observed 9000 deg2 at the north Galactic cap and a smaller  wide strip along the celestial equator. It is 95 per cent complete to 2 mJy and 80 per cent complete to the survey limit of 1 mJy. The survey contains over 800 000 unique sources, with an astrometric uncertainty of ≲ 1 arcsec.
The GB6 survey at 4.85 GHz was executed with the 91-m Green Bank telescope in 1986 November and 1987 October. Data from both epochs were assembled into a survey covering the 0° < δ < 75° sky down to a limiting flux of 18 mJy, with 3.5 arcmin resolution. GB6 contains over 75 000 sources, and has a positional uncertainty of about 10 arcsec at the bright end and about 50 arcsec for faint sources (Kimball & Ivezić 2008). The PMN surveys were performed using the Parkes 64-m radio telescope at a frequency of 4850 MHz with the NRAO multibeam receiver mounted at the prime focus (Griffith & Wright 1993). The surveys had a spatial resolution of approximately  FWHM and were made for the southern sky between declinations of −87° and +10°, and all right ascensions during June and November in 1990. The positional accuracy is close to 10 arcsec in each coordinate. The survey was divided into four declination bands. One of these four is the equatorial survey (
 ) covering 1.90 sr, which contains 11 774 sources to a flux limit of 40 mJy and largely overlaps the GB6 survey in the declination range from 0° to +10° (Griffith et al. 1995).
Source list.
The initial quasar sample was first cross-correlated with the SDSS quasar positions and the FIRST catalogue to within 2 arcsec (see e.g., Ivezić et al. 2002; Lu et al. 2007). The resulting sample of SDSS quasar positions was then cross-correlated with both the GB6 and PMN equatorial catalogues to within 1 arcmin (e.g., Kimball & Ivezić 2008). Owing to the different spatial resolutions of FIRST, GB6, and PMN, multiple FIRST counterparts were found to within 1 arcmin for some quasars, although only a single GB6 and/or PMN counterpart existed. The optical variability of quasars with single FIRST counterparts to within 1 arcmin of the SDSS positions was presented in Gu & Ai (2011). In this paper, we focus on the optical variability of quasars with multiple FIRST counterparts.
There are a total of 29 sources with multiple FIRST counterparts within 1 arcmin of their SDSS positions. The radio spectral index αr was then calculated between the integrated FIRST 1.4 GHz from multi-counterparts within 1 arcmin and either or both of the GB6 and PMN 4.85 GHz. Eleven sources are defined as SSRQs with αr > 0.5 using the integrated 1.4 GHz flux density. In comparison, only two sources are defined as SSRQs if only using 1.4 GHz flux density of the closest counterpart. This implies that most genuine SSRQs may appear as multi-FIRST components, but be identified as FSRQs when using the flux density of the closest FIRST component, which is actually much lower than that of radio lobes. When counterparts were found in both the GB6 and PMN surveys, the spectral indices were consistent with each other. To validate the spectral index, we searched for counterparts in the NRAO VLA Sky Survey (NVSS) within 1 arcmin of SDSS positions. The NVSS was also carried out using the VLA at 1.4 GHz to survey the entire sky north of δ = −40° and contains over 1.8 million unique detections brighter than 2.5 mJy, although at lower spatial resolution 45′′ beam-1. Owing to this lower spatial resolution, all sources have a single NVSS counterpart, except for five sources that have two counterparts, i.e. SDSS J015105.80−003426.4, SDSS J213513.10−005243.8, SDSS J221409.96+005227.0, SDSS J220719.77+004157.3, and SDSS J233624.04+000246.0. We then re-calculated the spectral index using the flux density of either single or integrated NVSS counterparts. We found that 25 out of 29 sources have consistent spectral index between using FIRST and NVSS. Three sources (SDSS J005905.51+000651.6, SDSS J013352.66+011345.1, and SDSS J021225.56+010056.1) changed from being identified as FSRQs to SSRQs based on their NVSS flux density; part of the emission from these sources might have been missed in FIRST images. One source, i.e. SDSS J015509.00+011522.5, changes from having a steep to a flat spectral index, but its spectral index is always close to 0.5, hence, it is still treated as a SSRQ. Among the 29 sources, 14 are defined as SSRQs with αr ≥ 0.5, whereas 15 objects are FSRQs with αr < 0.5 (see Table 1).
2.3. Sample
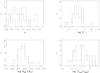 |
Fig. 1 The histogram of sample parameters: redshift (upper left), radio loudness (upper right), black hole mass (lower left), and the Eddington ratio (lower right). The dotted lines are for 19 SSRQs, and solid lines are for 15 FSRQs. |
For completeness, we include in the following analysis five SSRQs from the sample of Gu & Ai (2011), producing a sample of 19 SSRQs. The properties of these 19 SSRQs are listed in Table 1, which provides the source redshift, radio loudness, radio spectral index, black hole mass, disk bolometric luminosity, and the Eddington ratio. The same parameters for the 15 FSRQs are listed as a comparison. The distributions of redshift, radio loudness, black hole mass, and the Eddington ratio are shown in Fig. 1. We found that SSRQs are more extended in the distribution of each parameters than FSRQs. The source redshift is taken directly from the SDSS DR7 quasar catalogue, which covers 0.17 < z < 2.63 for SSRQs, while 0.34 < z < 2.00 for FSRQs. The radio loudness is from Shen et al. (2011), which ranges from log R = 1.80 (SDSS J013352.66+011345.1) to log R = 5.00 (SDSS J000622.60−000424.4) for SSRQs, whereas it is 1.55−3.54 for FSRQs. However, the radio loudness was calculated as R = f6 cm/f2500, where f6 cm and f2500 are the flux density at rest-frame 6 cm and 2500 Å, respectively (see Shen et al. 2011, for more details). Among 15 FSRQs, 4 sources have an inverted spectral index between 1.4 and 4.85 GHz with αr < 0.
Black hole masses were estimated from the various empirical relations in the literature by using the luminosity and FWHM of broad Hβ, Mg II, and C IV lines, i.e., Vestergaard & Peterson (2006) for Hβ, and Kong et al. (2006) for Mg II and C IV. The luminosity and FWHM of broad Hβ, Mg II, and C IV lines are adopted from the measurements in Shen et al. (2011). The BLR luminosity LBLR is derived following Celotti et al. (1997) by scaling the strong broad emission lines Hβ, Mg II, and C IV to the quasar template spectrum of Francis et al. (1991), in which Lyα is used as a flux reference of 100. By adding the contribution of Hα with a value of 77, the total relative BLR flux is 555.77, which consists of Hβ at 22, Mg II at 34, and C IV at 63 (Francis et al. 1991; Celotti et al. 1997). From the BLR luminosity, we estimate the disk bolometric luminosity as LBol = 10LBLR (Netzer 1990). It can be seen from Table 1 and Fig. 1 that the black hole mass of SSRQs ranges from 108.29 M⊙ to 1010.08 M⊙ for SSRQs, while in FSRQs it ranges from 108.44 M⊙ to 109.56 M⊙. The Eddington ratio of SSRQs given by log LBol/LEdd ranges from −2.35 to 0.52, while in FSRQs it ranges from −2.03 to 0.30.
3. Results
The SDSS DR7 CAS contains the Stripe82 database, containing all imaging from SDSS stripe 82 along the celestial equator at the southern Galactic cap. It includes a total of 303 runs, covering almost all of the 270 deg2 area approximately 80 times. Only about one-quarter of the stripe 82 scans were obtained in photometric conditions, the remainder being taken under variable clouds and often poorer than normal seeing. For the runs that were non-photometric, an approximate calibration, using the photometric frames as reference, was derived and made available in the CAS Stripe82 database. In this work, we directly used the point-spread-function magnitudes in the CAS Stripe82 database from the photometric data obtained during the SDSS-I phase from data release 7 (DR7; Abazajian et al. 2009) and the SN survey during 2005−2007. The typical measurement error in magnitude is about 0.03 mag.
Among the 19 SSRQs, we selected the sources classified as point sources in all observational runs. Only data with good measurements (high-quality photometry) were selected following the recommendations in the SDSS instructions1. Moreover, we insisted on the ugriz magnitude being brighter than the magnitude limit in each band, i.e. 22.0, 22.2, 22.2, 21.3, 20.5 at u, g, r, i, z, respectively. The data taken in cloudy conditions were also excluded. We calculated the spectral index αν from the linear fit to the log fν − log ν relation after applying an extinction correction to the ugriz flux density and taking the flux error into account. In most cases, the linear fit gave good fits. Each cycle of the ugriz photometry was usually completed within five minutes, i.e. quasi-simultaneously, therefore, the spectral index calculation will not be seriously influenced by any source variations.
3.1. SSRQs
3.1.1. Variability
Among the 19 SSRQs, SDSS J013352.66+011345.1 was excluded from our analysis owing to the low quality of its photometric data. All remaining 18 SSRQs display large amplitude variations with overall variations in r band of Δr = 0.22−0.92 mag (see Table 1). In general, the variations in different bands follow similar trends.
The correlation between the spectral index αν and PSF r magnitude was checked for all sources using the Spearman rank correlation analysis method. We found that 8 of 18 SSRQs show a significant positive correlation at a confidence level of > 99%. The positive correlation indicates that the source spectrum becomes flatter when the source is brighter. The result indicates that a bluer-when-brighter trend is clearly detected in these eight SSRQs.
3.1.2. Broad absorption-line quasars
Among the 18 SSRQs, we found that two sources are defined as broad absorption-line quasar (BALQ) in the literature. The source SDSS J024534.07+010813.7 (z = 1.5363) was listed as a BALQ in Gibson et al. (2009) selected from SDSS DR5. This source is also included in the First Bright Quasar Survey with the name of FBQS J0245+0108 (Becker et al. 2001). It appears as a single counterpart in the NVSS within 1 arcmin of a SDSS position, with a flux density of fNVSS = 337.9 mJy and position angle of 55.5 degree. However, it has three counterparts in the FIRST within 1 arcmin of SDSS positions (see Fig. 2). Three counterparts are aligned with a similar position angle to that of their NVSS counterpart. This difference is simply caused by the different spatial resolutions of FIRST and NVSS in the case that the radio structure can be resolved in the former, but not in the latter. The flux density of the closest FIRST counterpart is 11.67 mJy, while the integrated flux density of all counterparts is fFIRST = 317.2 mJy. Therefore, the radio emission of this source is produced predominantly by the large-scale double radio lobes. The spectral index calculated for the integrated FIRST 1.4 GHz and PMN 4.85 GHz flux density of fPMN = 115 mJy is αr = 1.05, while it is αr = 0.82 when the GB6 4.85 GHz flux density of fGB6 = 85.7 mJy is used. In contrast, the spectral index will be highly inverted only if the flux density of the closest FIRST counterpart is used.
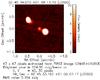 |
Fig. 2 The FIRST radio image of SDSS J024534.07+010813.7. |
 |
Fig. 3 The ugriz band light curve of SDSS J024534.07+010813.7 (from top to bottom). |
The light curves of SDSS J024534.07+010813.7 in u, g, r, i, and z bands are shown in Fig. 3. The variations exhibit similar trends in all bands, over seven years from 2000 to 2007. The overall variation in r band is 0.29 mag. In the observational sessions, the source became gradually fainter from 2000 to 2004, and then remained quite stable from 2004 to 2007.
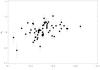 |
Fig. 4 The relationship between the spectral index and the PSF magnitude at r band for SDSS J024534.07+010813.7. A significant positive correlation is present, which implies a bluer-when-brighter trend. |
For the data of SDSS J024534.07+010813.7, we found a significant positive correlation present between the spectral index αν and r magnitude, which is shown in Fig. 4. The Spearman correlation analysis shows a significant positive correlation with a correlation coefficient of rs = 0.435 at confidence level of > 99.9%. This positive correlation indicates that the source spectrum becomes flatter when the source is brighter, i.e. that there is a bluer-when-brighter trend. With the source redshift z = 1.5363, SDSS ugriz wavebands correspond to the wavelength range of 1400−3521 Å in the source rest-frame. For a sample of 17 radio-quiet AGNs, Shang et al. (2005) show that the spectral break occurs at around 1100 Å for most objects, which is thought to be closely related to the big blue bump. If this spectral break also existed in SDSS J024534.07+010813.7, we would expect to observe the rising part of accretion-disk thermal emission when it dominates over the nonthermal emission. However, the spectral index in the observational sessions are in the range of 1.59 to 2.03, which is indicative of a declining SED in the rest frame 1400−3521 Å. This might be caused by the internal extinction in the quasar itself, for example, from the outflowing absorption gas.
We found another BALQ SDSS J021728.62−005227.2 (z = 2.4621) in SSRQs of Gu & Ai (2011). It is defined as BALQ in Trump et al. (2006), who studied a sample drawn from SDSS DR3, but as SSRQs in Gu & Ai (2011) with radio spectral index of αr = 0.75. Its overall variations in amplitude in r band is Δr = 0.35. The significant positive correlation between the r magnitude and the optical spectral index displays a bluer-when-brighter trend for this source. However, unlike SDSS J024534.07+010813.7, the spectral index varies from 0.45 to 1.28, most of the time remaining at < 1.0. The internal extinction caused by the outflowing absorption gas may not be so great in this source.
3.2. FSRQs
All 15 FSRQs display large amplitude variations with overall variations in r band of Δr = 0.18−0.97 (see Table 1). The correlation between the spectral index αν and PSF r magnitude was checked for all sources using the Spearman rank correlation analysis method. We found that 11 of 15 FSRQs show a significant positive correlation at a confidence level of > 99%, i.e. a bluer-when-brighter trend.
3.3. BLR geometry
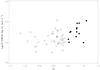 |
Fig. 5 The line width of broad Mg II line versus radio spectral index. The solid circles represent SSRQs, while the open circles are for FSRQs. |
Assuming the radio spectral index as an indicator of orientation, the BLR geometry can be investigated by considering the line width of the broad emission lines (Fine et al. 2011). To this end, we combine all sources in this work and those FSRQs in Gu & Ai (2011) to produce a sample of 62 quasars, including 18 SSRQs and 44 FSRQs. The relationship between the radio spectral index and the FWHM of the Mg II line is shown in Fig. 5 for a subsample of 55 sources (42 FSRQs and 13 SSRQs) with available Mg II line measurements. There is a trend of broader Mg II lines with steeper spectral index. The Spearman rank correlation analysis shows a positive correlation with correlation coefficient of rs = 0.298 at a confidence level of 97.3%. The mean value of Mg II FWHM is 4075 km s-1 for FSRQs, while it is 6110 km s-1 for SSRQs. The median value of Mg II FWHM is 3586 km s-1 and 5694 km s-1 for FSRQs and SSRQs, respectively. Although our sample is much smaller than theirs, the results are consistent with that of Fine et al. (2011), which used the radio spectral index between Westerbork Northern Sky Survey 330 MHz and NVSS 1.4 GHz. This result indicates a disk-like BLR geometry may be present in these quasars.
4. Discussions
4.1. SSRQs and FSRQs
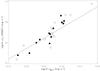 |
Fig. 6 The plot of broad Mg II line luminosity and continuum luminosity at 3000 Å for 13 SSRQs and 14 FSRQs. The symbols are same as in Fig. 4. The square is for BALQ SDSS J024534.07+010813.7. The solid line is the OLS bisector linear fit to radio-quiet AGNs in Kong et al. (2006), |
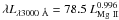
While FSRQs are usually associated with core-dominated radio quasars, SSRQs are generally related to lobe-dominated ones, usually with two large-scale optically thin radio lobes. The beaming effect is usually not strong in SSRQs because of the relatively large viewing angle. Therefore, the optical continuum of SSRQs can be dominated by the thermal emission. In Fig. 6, most SSRQs with available Mg II measurements lie close to or below the solid line for radio-quiet AGNs. The average value of the ratio of the luminosity at 3000 Å to that of broad Mg II line is ⟨ log (νLν(3000 Å)/LMg II) ⟩ = 1.78 ± 0.26, which is in good agreement with the linear relation for radio-quiet AGNs (see Fig. 6). This likely implies that the thermal emission from accretion disk is indeed the dominant one in the optical continuum at the epoch of SDSS spectra for most SSRQs, if not all. For comparison, the Mg II measurements of 14 FSRQs are also plotted in Fig. 6. We found that the distribution of FSRQs is generally similar to that of SSRQs, but has a larger scatter. The average value of the ratio of the luminosity at 3000 Å to that of broad Mg II line is ⟨ log (νLν(3000 Å)/LMg II) ⟩ = 1.81 ± 0.31, which is slightly larger than that of SSRQs. This may imply that the optical nonthermal jet emission may not be dominant in all FSRQs, as found by Chen et al. (2009).
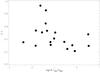 |
Fig. 7 The Eddington ratio versus the variability at r band Δr for SSRQs. |
Interestingly, eight of 18 SSRQs follow a BWB trend (see Table 1). The BWB trend has also been found in radio-quiet AGNs, for which the variability was found to be anti-correlated with the Eddington ratio (Pu et al. 2006; Ai et al. 2010). In radio-quiet AGNs, the optical variability could be due to the variation in the accretion process, for example, the variation in the accretion rate (e.g., Li & Cao 2008), since the jet is either weak or absent. These explanations could also be used to explain the variability of SSRQs if the optical emission is indeed mainly from the accretion disk. To investigate the mechanism of variability in SSRQs, the relationship between the variability Δr and the Eddington ratio is plotted in Fig. 7. We found an anti-correlation with a Spearman correlation coefficient of rs = −0.490 at a confidence level of 96.2%. This similar anti-correlation to that of radio-quiet AGNs, strongly implies that the mechanisms of optical variability may be similar in the two populations. The thermal emission from the accretion disk may be responsible for the variability of SSRQs. In contrast, there is no correlation for FSRQs. This implies that the mechanism of variability in FSRQs may be different from that of SSRQs. However, that the variation in SSRQs is caused by jet nonthermal emission cannot be completely excluded in some cases because the variability amplitudes are generally larger that the typical values for radio quiet AGNs, i.e., 0.05− 0.3 mag (e.g., Ai et al. 2010), (see Table 1). In extreme cases, the overall amplitude is Δr = 0.92 mag in SDSS J013514.39−000703.8. It may be more likely that both thermal and nonthermal emission contribute to the variability. Further multi-waveband monitoring is needed to help resolve these uncertainties, especially the spectroscopic monitoring.
In terms of optical variability on month-to-year timescales, no obvious difference was found in the behavior of radio-quiet quasars and lobe-dominated quasars (LDQs) (Stalin et al. 2004). Moreover, there is no significant difference in either the amplitude or duty cycle of intranight optical variability (INOV) between these two classes of non-blazar AGNs. However, their sample is too small, and the time spanned by observations is too short. Nevertheless, the authors infer that the radio loudness of a quasar alone is an insufficient condition for a pronounced INOV. While the observational data cannot exclude accretion disk flares as the source of the intranight optical variability in radio-quiet quasars and LDQs, it does not preclude a substantial contribution from blazar-like relativistically beamed emission. As suggested by Stalin et al. (2005), the radio-quiet quasars may also eject relativistic jets. However, their jets are probably quenched while crossing the innermost micro-arcsecond scale, possibly through heavy inverse Compton losses in the vicinity of the central engine (e.g., Gopal-Krishna et al. 2003). However, the analysis of spectra of a set of radio quiet quasars that had already been searched for microvariability showed that the jet-based scenario is unlikely (Chand et al. 2010).
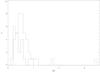 |
Fig. 8 The histogram of Δr for SSRQs and FSRQs in Gu & Ai (2011) and in this work. The dotted lines are for 18 SSRQs, and solid lines are for 44 FSRQs. |
To compare systematically the variations of SSRQs with FSRQs, we combined the FSRQs of Gu & Ai (2011) with sources in this work. The combined sample consists of 62 quasars, of which 44 are FSRQs, and 18 are SSRQs. We show the histogram of variation amplitude in r band Δr for both SSRQs and FSRQs in Fig. 8. It can be seen that Δr of FSRQs are systematically larger than that of SSRQs, with median value of 0.52 mag and 0.41 mag for FSRQs and SSRQs, respectively. Apparently, FSRQs cover a wider range in Δr. Four FSRQs exhibit Δr > 1.0 mag with an extreme case of Δr = 3.46 (see Gu & Ai 2011), while none among the SSRQs. This implies that the variations in FSRQs are systematically more dramatic than SSRQs. This is most likely due to the relativistic jet, which is viewed at a smaller viewing angle in FSRQs. That the typical variations amplitude of SSRQs is in-between the values of radio quiet AGNs and FSRQs is qualitatively consistent with the source nature of SSRQs, which are radio-loud sources with prominent powerful relativistic jets viewed however at larger viewing angle that leads to dominant thermal emission at optical wavebands. In terms of the spectral variations, eight of 18 SSRQs agree with the BWB relation at a confidence level of >99%, i.e. at probability of ~44%. In contrast, 25 (~57%) of the 44 FSRQs follow a BWB trend at confidence level of >99%, while only one source is consistent with a RWB trend at a confidence level of >99%. Therefore, it seems that BWB trend are quite common in both FSRQs and SSRQs, although the mechanisms can be different, for example, shock-in-jet and accretion rate changes can explain the observations of FSRQs and SSRQs, respectively.
In the unification scheme of AGNs, the radio galaxies are generally unified with radio quasars (Antonucci 1993), in which radio galaxies are viewed at large viewing angles. The jet emission in radio galaxies are not significantly boosted, hence the predominant optical emission is expected to be thermal emission related to the accretion disk. It is indeed argued that the optical and X-ray emission arise from the accretion disk and corona system in two radio galaxies 3C 120 and 3C 111 by using extensive multi-frequency monitoring data (Chatterjee et al. 2009, 2011). In both sources, the low optical polarization supports the thermal origin of the optical emission. However, in 3C 111 the detection of polarization percentages of 3% or even higher suggests that during particular activity phases an additional contribution from non-thermal emission from the jet may be present (Jorstad et al. 2007; Chatterjee et al. 2011). Interestingly, significant dips in the X-ray light curve are followed by ejections of bright superluminal knots in the VLBA images for both sources. The authors argued that the radiative state of accretion disk plus corona system, where the X-rays are produced, has a direct effect on the events in the jet, where the radio emission originates.
As for many FSRQs studied by Gu & Ai (2011) with a spectral index αν < 1.0, almost all FSRQs in this work display a αν < 1.0, which implies that they have a rising SED in optical regions. One possibility is that the optical emission originates mainly from thermal accretion disk, although these sources are defined as FSRQs. Alternatively, they might be high-synchrotron-peaked FSRQs, since the synchrotron peak frequency is higher than the rest-frame frequency of SDSS ugriz wavebands. This idea would however need to be verified.
4.2. BALQs
The nature of BAL quasars is still unclear. It has been argued that the outflowing BAL wind is preferentially equatorial, and only those objects with almost edge-on accretion disks to the line of sight, can be observed as BAL (Cohen et al. 1995; Goodrich & Miller 1995). However, the VLBI radio images of BALQs are inconsistent with this orientation scenario, in terms of the radio structures and both the steep and flat radio spectrum (e.g., Jiang & Wang 2003; Liu et al. 2008; Doi et al. 2009). Fine et al. (2011) found no evidence that BAL QSOs have a different spectral index distribution to non-BALs, although only 25 obvious BALs are considered in their sample. Their BALQs have both steep and flat radio spectra, which were computed using the Westerbork Northern Sky Survey (WENSS) at 330 MHz and the NVSS at 1.4 GHz. In general, the radio-loud BALQs tend to be compact in the radio, similar to gigahertz-peaked spectrum (GPS) and compact steep spectrum (CSS) sources, which are thought to the progenitors of large-scale radio sources (Becker et al. 2000; Montenegro-Montes et al. 2009). It has been proposed that the BALs are not closely related with the inclinations, and may be associated with a relatively short-lived evolutionary phase with a large BAL-wind covering-fraction (e.g., Briggs et al. 1984; Gregg et al. 2000). We found that the two radio-loud steep spectrum BALQs in this current paper have different radio structures. The quasar SDSS J024534.07+010813.7 has prominent extended double radio lobes, of which the emission dominates over that of radio core (see Fig. 2). The source is too extended (~52 arcsec, i.e. ~440 kpc) to be considered as a CSS/GPS, and has not been imaged with VLBI. In contrast, SDSS J021728.62−005227.2 is compact in the FIRST image with only a single FIRST counterpart being found. It has been imaged with VLBI by Doi et al. (2009). However, only a compact component was found with flux density at 8.4 GHz f8.4 GHz = 43 mJy on a scale of <1 kpc. In combination with the FIRST flux density, the radio spectrum is steep αr = 0.9, which makes this source resemble CSS and thus likely to be a young radio source. More radio observations at higher spatial resolution would help us to determine the nature of this source.
While there have been many investigations of the variability of broad absorption-line troughs (e.g., Barlow 1993; Lundgren et al. 2007; Gibson et al. 2008, 2010; Capellupo et al. 2011), not many have been done for the optical continuum variability for BALQs. On timescales of the order of years, the optical continuum variability of BALQs was found to differ markedly from that of non-BAL radio quiet quasars (Turnshek 1988). On short timescales, intranight optical variations of ~5−9% were detected on timescales of ~1 h in two BALQs (Anupama & Chokshi 1998). The search of Joshi et al. (2011) for optical microvariability in 19 radio quiet BALQs argued that radio quiet BALQs do not appear to be a special case of the radio-quiet quasars in terms of their similar duty cycle. However, all these observations focused only on the radio-quiet BALQs. Therefore, for the first time, we present here the optical continuum variability of radio-loud BALQs, although only two BALQ sources were found in our sample. In both BALQs, the C IV BAL troughs fall outside the ugriz bands, which in addition to the similar trends of variability in different wavebands, rule out the possibility of the observed light-curve variations being caused by variations in the strength of the BAL features. The variation amplitude in the r band of two sources is not atypical of the overall sample of SSRQs, although they are at the low end of the distribution in Fig. 8. This implies that the mechanism of optical continuum variability of radio-loud BALQs is likely to be similar to that of more general SSRQs. Interestingly, both BALQs follow a BWB trend, which indicates that the probability of BALQ sources showing BWB trend is higher than that of SSRQs. However, the small sample size precludes us being able to draw any firm conclusions. A larger sample is certainly needed for further investigations. The spectral index of two BALQs in this work are steeper than the typical value of other SSRQs, which implies more reddened in BALQs than non-BALQs. This is consistent with previous results (Trump et al. 2006; Gibson et al. 2009).
5. Summary
We have constructed a sample of 19 SSRQs and 15 FSRQs in the SDSS Stripe 82 region. The variability and the relationship between the spectral index and brightness were investigated for 18 SSRQs and 15 FSRQs. We found that all SSRQs have large-amplitude overall variations, e.g., from 0.22 to 0.92 mag in r band. We found a bluer-when-brighter trend in 8 of the 18 SSRQs studied here. In contrast, the variability amplitude of 15 FSRQs in r band ranges from 0.18 to 0.97 mag, and 11 of 15 sources follow a BWB trend. We found an anti-correlation between the Eddington ratio and the variability amplitude in r band for SSRQs, which is similar to that in radio quiet AGNs. This implies that the thermal emission from accretion disk may be responsible for the variability in SSRQs, although the jet nonthermal emission cannot be excluded. In contrast, there is no correlation in FSRQs, which implies that the mechanisms of variability in FSRQs may be different from that in SSRQs. The optical continuum variability of radio-loud BALQs is investigated for the first time here on two sources with steep radio spectrum. Both radio-loud BALQs show variations with amplitude of about 0.3 mag at r band. Their spectral variability all show a bluer-when-brighter trend. In combination with 29 FSRQs also selected from Stripe 82 region in Gu & Ai (2011), we found a trend of a broader line width of broad Mg II line with steeper radio spectral index. This implies that a disk-like BLR geometry may be present in these quasars. In these 62 quasars, we found a ~57% source percentage showing BWB trend in FSRQs, whereas it is ~ 44% in SSRQs.
Acknowledgments
We thank the anonymous referee for constructive comments that improved the manuscript. MFG thanks X. Cao, S. Li, A. Gupta, J. Wu and Z. Chen for useful discussions. This work is supported by the National Science Foundation of China (grants 10833002, 10978009, 11033007 and 11073039), and by the 973 Program (No. 2009CB824800). Funding for the SDSS and SDSS-II was provided by the Alfred P. Sloan Foundation, the Participating Institutions, the National Science Foundation, the US Department of Energy, the National Aeronautics and Space Administration, the Japanese Monbukagakusho, the Max Planck Society, and the Higher Education Funding Council for England. The SDSS Web site is http://www.sdss.org/.
References
- Abazajian, K. N., Adelman-McCarthy, J. K., Agüeros, M. A., et al. 2009, ApJS, 182, 543 [NASA ADS] [CrossRef] [Google Scholar]
- Ai, Y. L., Yuan, W., Zhou, H. Y., et al. 2010, ApJ, 716, L31 [NASA ADS] [CrossRef] [Google Scholar]
- Antonucci, R. 1993, ARA&A, 31, 473 [Google Scholar]
- Anupama, G. C., & Chokshi, A. 1998, ApJ, 494, L147 [NASA ADS] [CrossRef] [Google Scholar]
- Barlow, T. A. 1993, Ph.D. Thesis, Univ. California, San Diego [Google Scholar]
- Becker, R. H., White, R. L., & Helfand, D. J. 1995, ApJ, 450, 559 [NASA ADS] [CrossRef] [Google Scholar]
- Becker, R. H., White, R. L., Gregg, M. D., et al. 2000, ApJ, 538, 72 [NASA ADS] [CrossRef] [Google Scholar]
- Becker, R. H., White, R. L., Gregg, M. D., et al. 2001, ApJS, 135, 227 [NASA ADS] [CrossRef] [Google Scholar]
- Briggs, F. H., Turnshek, D. A., & Wolfe, A. M. 1984, ApJ, 287, 549 [NASA ADS] [CrossRef] [Google Scholar]
- Capellupo, D. M., Hamann, F., Shields, J. C., Rodríguez Hidalgo, P., & Barlow, T. A. 2011, MNRAS, 413, 908 [NASA ADS] [CrossRef] [Google Scholar]
- Celotti, A., Padovani, P., & Ghisellini, G. 1997, MNRAS, 286, 415 [NASA ADS] [CrossRef] [EDP Sciences] [Google Scholar]
- Chand, H., Wiita, P. J., & Gupta, A. C. 2010, MNRAS, 402, 1059 [NASA ADS] [CrossRef] [Google Scholar]
- Chatterjee, R., Marscher, A. P., Jorstad, S. G., et al. 2009, ApJ, 704, 1689 [NASA ADS] [CrossRef] [Google Scholar]
- Chatterjee, R., Marscher, A. P., Jorstad, S. G., et al. 2011, ApJ, 734, 43 [Google Scholar]
- Chen, Z. Y., Gu, M. F., & Cao, X. 2009, MNRAS, 397, 1713 [NASA ADS] [CrossRef] [Google Scholar]
- Clements, S. D., & Carini, M. T. 2001, AJ, 121, 90 [NASA ADS] [CrossRef] [Google Scholar]
- Cohen, M. H., Ogle, P. M., Tran, H. D., et al. 1995, ApJ, 448, L77 [NASA ADS] [CrossRef] [Google Scholar]
- D’Ammando, F., Raiteri, C. M., Villata, M., et al. 2011, A&A, 529, A145 [NASA ADS] [CrossRef] [EDP Sciences] [Google Scholar]
- Doi, A., Kawaguchi, N., Kono, Y., et al. 2009, PASJ, 61, 1389 [NASA ADS] [Google Scholar]
- Fan, J. H., Xie, G. Z., Pecontal, E., Pecontal, A., & Copin, Y. 1998, ApJ, 507, 173 [NASA ADS] [CrossRef] [Google Scholar]
- Fine, S., Jarvis, M. J., & Mauch, T. 2011, MNRAS, 412, 213 [NASA ADS] [CrossRef] [Google Scholar]
- Francis, P. J., Hewett, P. C., Foltz, C. B., et al. 1991, ApJ, 373, 465 [NASA ADS] [CrossRef] [Google Scholar]
- Ghisellini, G., Villata, M., Raiteri, C. M., et al. 1997, A&A, 327, 61 [NASA ADS] [Google Scholar]
- Ghosh, K. K., Ramsey, B. D., Sadun, A. C., & Soundararajaperumal, S. 2000, ApJS, 127, 11 [NASA ADS] [CrossRef] [Google Scholar]
- Gibson, R. R., Brandt, W. N., Schneider, D. P., & Gallagher, S. C. 2008, ApJ, 675, 985 [NASA ADS] [CrossRef] [Google Scholar]
- Gibson, R. R., Jiang, L., Brandt, W. N., et al. 2009, ApJ, 692, 758 [NASA ADS] [CrossRef] [Google Scholar]
- Gibson, R. R., Brandt, W. N., Gallagher, S. C., Hewett, P. C., & Schneider, D. P. 2010, ApJ, 713, 220 [NASA ADS] [CrossRef] [Google Scholar]
- Goodrich, R. W., & Miller, J. S. 1995, ApJ, 448, L73 [NASA ADS] [CrossRef] [Google Scholar]
- Gopal-Krishna, Sagar, R., & Wiita, P. J. 1995, MNRAS, 274, 701 [NASA ADS] [CrossRef] [Google Scholar]
- Gopal-Krishna, Stalin, C. S., Sagar, R., & Wiita, P. J. 2003, ApJ, 586, L25 [NASA ADS] [CrossRef] [Google Scholar]
- Gregg, M. D., Becker, R. H., Brotherton, M. S., et al. 2000, ApJ, 544, 142 [NASA ADS] [CrossRef] [Google Scholar]
- Gregory, P. C., Scott, W. K., Douglas, K., & Condon, J. J. 1996, ApJS, 103, 427 [NASA ADS] [CrossRef] [Google Scholar]
- Grandi, P., & Palumbo, G. 2004, Science, 306, 998 [NASA ADS] [CrossRef] [Google Scholar]
- Griffith, M. R., & Wright, A. E. 1993, AJ, 105, 1666 [NASA ADS] [CrossRef] [Google Scholar]
- Griffith, M. R., Wright, A. E., Burke, B. F., & Ekers, R. D. 1995, ApJS, 97, 347 [NASA ADS] [CrossRef] [Google Scholar]
- Gu, M. F., Lee, C.-U., Pak, S., Yim, H. S., & Fletcher, A. B. 2006, A&A, 450, 39 [NASA ADS] [CrossRef] [EDP Sciences] [Google Scholar]
- Gu, M. F., & Ai, Y. L. 2011, A&A, 528, A95 [NASA ADS] [CrossRef] [EDP Sciences] [Google Scholar]
- Gupta, A. C., & Joshi, U. C. 2005, A&A, 440, 855 [NASA ADS] [CrossRef] [EDP Sciences] [Google Scholar]
- Hu, S. M., Zhao, G., Guo, H. Y., Zhang, X., & Zheng, Y. G. 2006, MNRAS, 371, 1243 [NASA ADS] [CrossRef] [Google Scholar]
- Ivezić, Ž., Menou, K., Knapp, G. R., et al. 2002, AJ, 124, 2364 [NASA ADS] [CrossRef] [Google Scholar]
- Jiang, D. R., & Wang, T. G. 2003, A&A, 397, L13 [NASA ADS] [CrossRef] [EDP Sciences] [Google Scholar]
- Jorstad, S. G., Marscher, A. P., Stevens, J. A., et al. 2007, AJ, 134, 799 [NASA ADS] [CrossRef] [Google Scholar]
- Joshi, R., Chand, H., Gupta, A. C., & Wiita, P. J. 2011, MNRAS, 412, 2717 [NASA ADS] [CrossRef] [Google Scholar]
- Kimball, A. E., & Ivezić, Ž. 2008, AJ, 136, 684 [NASA ADS] [CrossRef] [Google Scholar]
- Kong, M. Z., Wu, X. B., Wang, R., & Han, J. L. 2006, Chinese J. Astron. Astrophys., 6, 396 [Google Scholar]
- Li, S. L., & Cao, X. W. 2008, MNRAS, 387, L41 [NASA ADS] [CrossRef] [Google Scholar]
- Liu, Y., Jiang, D. R., & Gu, M. F. 2006, ApJ, 637, 669 [NASA ADS] [CrossRef] [Google Scholar]
- Liu, Y., Jiang, D. R., Wang, T. G., & Xie, F. G. 2008, MNRAS, 391, 246 [NASA ADS] [CrossRef] [Google Scholar]
- Lu, Y., Wang, T., Zhou, H., & Wu, J. 2007, AJ, 133, 1615 [NASA ADS] [CrossRef] [Google Scholar]
- Lundgren, B. F., Wilhite, B. C., Brunner, R. J., et al. 2007, ApJ, 656, 73 [NASA ADS] [CrossRef] [Google Scholar]
- Lupton, R. H., Ivezić, Ž., Gunn, J. E., et al. 2002, Proc. SPIE, 4836, 350 [NASA ADS] [CrossRef] [Google Scholar]
- Massaro, E., Nesci, R., Maesano, M., Montagni, F., & D’Alessio, F. 1998, MNRAS, 299, 47 [NASA ADS] [CrossRef] [Google Scholar]
- Montenegro-Montes, F. M., Mack, K.-H., Benn, C. R., et al. 2009, Astron. Nachr., 330, 157 [NASA ADS] [CrossRef] [Google Scholar]
- Netzer, H. 1990 in Active Galactic Nuclei, ed. R. D. Blandford et al. (Berlin: Springer), 57 [Google Scholar]
- Peterson, B. M. 1993, PASP, 105, 247 [NASA ADS] [CrossRef] [Google Scholar]
- Pian, E., Urry, C. M., Maraschi, L., et al. 1999, ApJ, 521, 112 [NASA ADS] [CrossRef] [Google Scholar]
- Poon, H., Fan, J. H., & Fu, J. N. 2009, ApJS, 185, 511 [NASA ADS] [CrossRef] [Google Scholar]
- Pu, X., Bian, W., & Huang, K. 2006, MNRAS, 372, 246 [NASA ADS] [CrossRef] [Google Scholar]
- Raiteri, C. M., Villata, M., Aller, H. D., et al. 2001, A&A, 377, 396 [NASA ADS] [CrossRef] [EDP Sciences] [Google Scholar]
- Raiteri, C. M., Villata, M., Larionov, V. M., et al. 2007, A&A, 473, 819 [NASA ADS] [CrossRef] [EDP Sciences] [Google Scholar]
- Rani, B., Gupta, A. C., Strigachev, A., et al. 2010, MNRAS, 404, 1992 [NASA ADS] [Google Scholar]
- Schneider, D. P., Richards, G. T., Hall, P. B., et al. 2010, AJ, 139, 2360 [NASA ADS] [CrossRef] [Google Scholar]
- Shang, Z. H., Brotherton, M. S., Green, R. F., et al. 2005, ApJ, 619, 41 [NASA ADS] [CrossRef] [Google Scholar]
- Shen, Y., Richards, G. T., Strauss, M. A., et al. 2011, ApJS, 194, 45 [NASA ADS] [CrossRef] [Google Scholar]
- Stalin, C. S., Gopal-Krishna, Sagar, R., & Wiita, P. J. 2004, MNRAS, 350, 175 [NASA ADS] [CrossRef] [Google Scholar]
- Stalin, C. S., Gupta, A. C., Gopal-Krishna, Wiita, P. J., & Sagar, R. 2005, MNRAS, 356, 607 [NASA ADS] [CrossRef] [Google Scholar]
- Trump, J. R., Hall, P. B., Reichard, T. A., et al. 2006, ApJS, 165, 1 [NASA ADS] [CrossRef] [Google Scholar]
- Turnshek, D. A. 1988, in QSO absorption lines: probing the Universe, ed. J. C. Blades et al. (Cambridge), 17 [Google Scholar]
- Vagnetti, F., Trevese, D., & Nesci, R. 2003, ApJ, 590, 123 [NASA ADS] [CrossRef] [Google Scholar]
- Vestergaard, M., & Peterson, B. M. 2006, ApJ, 641, 689 [NASA ADS] [CrossRef] [Google Scholar]
- Villata, M., Raiteri, C. M., Kurtanidze, O. M., et al. 2002, A&A, 390, 407 [NASA ADS] [CrossRef] [EDP Sciences] [Google Scholar]
- Wiita, P. J., 1996, in Blazar Continuum Variability, ed. H. R. Miller, J. R. Webb, & J. C. Noble, ASP Conf. Ser., 110 (San Francisco: ASP), 42 [Google Scholar]
- Wu, J. H., Peng, B., Zhou, X., et al. 2005, AJ, 129, 1818 [NASA ADS] [CrossRef] [Google Scholar]
- Wu, J. H., Zhou, X., Ma, J., et al. 2007, AJ, 133, 1599 [NASA ADS] [CrossRef] [Google Scholar]
- Wu, J. H., Zhou, X., Ma, J., & Jiang, Z. J. 2011, MNRAS, accepted [arXiv:1108.1020] [Google Scholar]
All Tables
All Figures
|
Fig. 1 The histogram of sample parameters: redshift (upper left), radio loudness (upper right), black hole mass (lower left), and the Eddington ratio (lower right). The dotted lines are for 19 SSRQs, and solid lines are for 15 FSRQs. |
| In the text | |
|
Fig. 2 The FIRST radio image of SDSS J024534.07+010813.7. |
| In the text | |
|
Fig. 3 The ugriz band light curve of SDSS J024534.07+010813.7 (from top to bottom). |
| In the text | |
|
Fig. 4 The relationship between the spectral index and the PSF magnitude at r band for SDSS J024534.07+010813.7. A significant positive correlation is present, which implies a bluer-when-brighter trend. |
| In the text | |
|
Fig. 5 The line width of broad Mg II line versus radio spectral index. The solid circles represent SSRQs, while the open circles are for FSRQs. |
| In the text | |
|
Fig. 6 The plot of broad Mg II line luminosity and continuum luminosity at 3000 Å for 13 SSRQs and 14 FSRQs. The symbols are same as in Fig. 4. The square is for BALQ SDSS J024534.07+010813.7. The solid line is the OLS bisector linear fit to radio-quiet AGNs in Kong et al. (2006), |
| In the text | |
|
Fig. 7 The Eddington ratio versus the variability at r band Δr for SSRQs. |
| In the text | |
|
Fig. 8 The histogram of Δr for SSRQs and FSRQs in Gu & Ai (2011) and in this work. The dotted lines are for 18 SSRQs, and solid lines are for 44 FSRQs. |
| In the text | |
Current usage metrics show cumulative count of Article Views (full-text article views including HTML views, PDF and ePub downloads, according to the available data) and Abstracts Views on Vision4Press platform.
Data correspond to usage on the plateform after 2015. The current usage metrics is available 48-96 hours after online publication and is updated daily on week days.
Initial download of the metrics may take a while.