Fig. 3
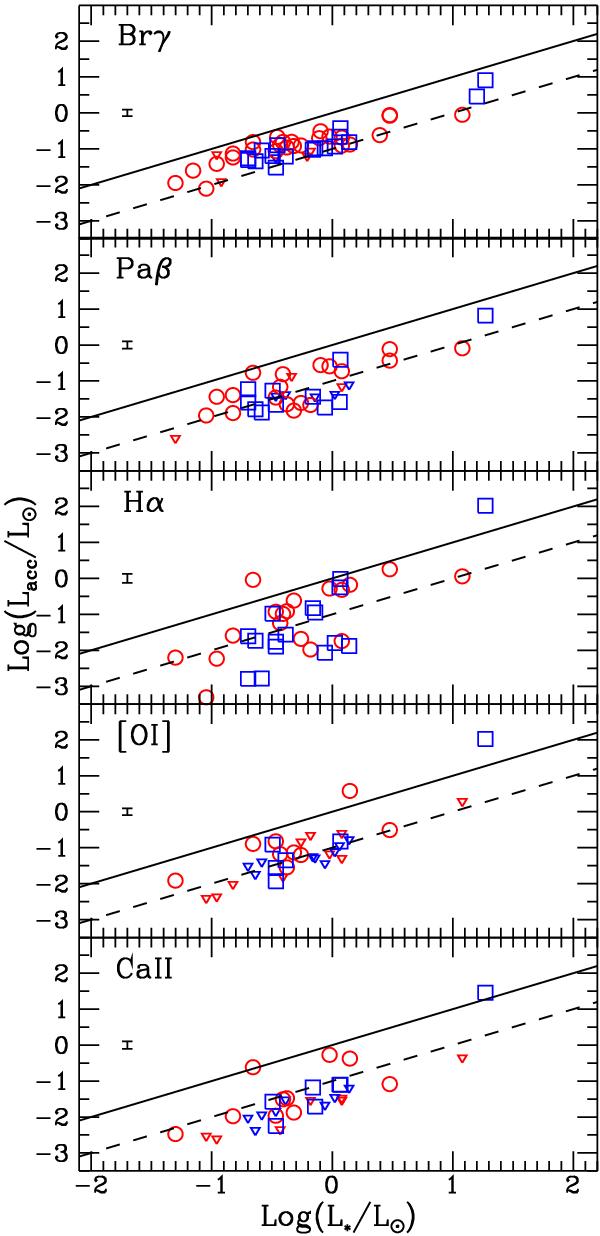
Lacc values for the different accretion tracers considered (see Tables 5 and 6) plotted as a function of L∗: from top to bottom Brγ, Paβ, Hα, [O i] λ6300, Ca ii λ8542. Red circles and blue squares refer to detections of Cha I and Cha II objects, respectively. Upper limits are indicated by downward triangles. The solid and dashed lines show the locus where Lacc = L∗ and Lacc = 0.1 L∗, respectively. The error bars reflect only the assumed uncertainty of 0.5 mag for the 2MASS K band magnitude used as reference for the absolute flux calibration of the spectra (see Sect. 4).
Current usage metrics show cumulative count of Article Views (full-text article views including HTML views, PDF and ePub downloads, according to the available data) and Abstracts Views on Vision4Press platform.
Data correspond to usage on the plateform after 2015. The current usage metrics is available 48-96 hours after online publication and is updated daily on week days.
Initial download of the metrics may take a while.