Fig. 5
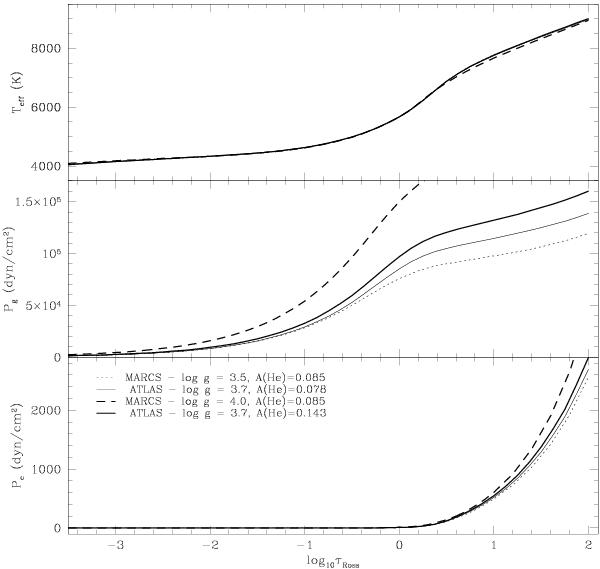
Comparison of thermal and pressure structure of 5250 K MARCS models with specially computed ATLAS 12 models. The top panel shows the temperature variation with the logarithmic Rosseland opacity, the middle panel the gas pressure variation, and the bottom panel the electron pressure variation. The MARCS models have normal helium abundance and different gravities (log g = 3.5 dex plotted as a dotted line and log g = 4.0 dex as a dashed line). The ATLAS 12 models have normal helium (thin continuous line) and enhanced helium (thick continuous line) at a fixed gravity of 3.7 dex.
Current usage metrics show cumulative count of Article Views (full-text article views including HTML views, PDF and ePub downloads, according to the available data) and Abstracts Views on Vision4Press platform.
Data correspond to usage on the plateform after 2015. The current usage metrics is available 48-96 hours after online publication and is updated daily on week days.
Initial download of the metrics may take a while.