Free Access
Fig. 4
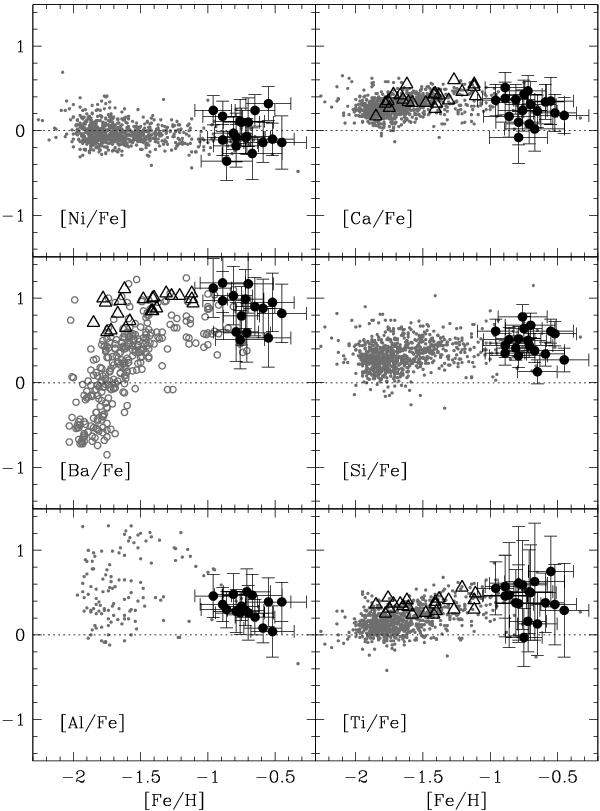
Abundance ratios for all measured elements. In all panels, grey dots are the measurements by Johnson & Pilachowski (2010), grey empty circles by Marino et al. (2011), the empty triangles the ones by Villanova et al. (2007), and the black dots with errorbars our measurements.
Current usage metrics show cumulative count of Article Views (full-text article views including HTML views, PDF and ePub downloads, according to the available data) and Abstracts Views on Vision4Press platform.
Data correspond to usage on the plateform after 2015. The current usage metrics is available 48-96 hours after online publication and is updated daily on week days.
Initial download of the metrics may take a while.