Free Access
Fig. 2
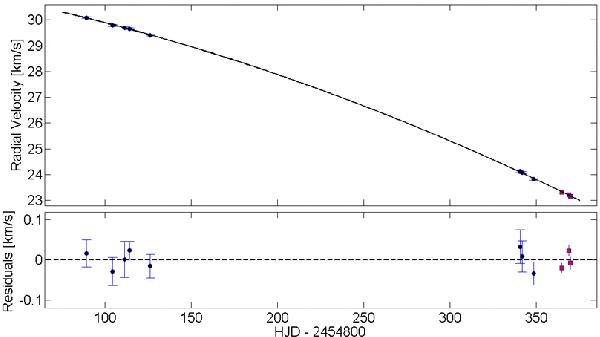
RVs of the primary in C0121 as measured by the SOPHIE (black circles) and HARPS (red boxes) spectrographs using CCF. The solid black line is a second-degree polynomial fit. The residuals are plotted at the bottom.
Current usage metrics show cumulative count of Article Views (full-text article views including HTML views, PDF and ePub downloads, according to the available data) and Abstracts Views on Vision4Press platform.
Data correspond to usage on the plateform after 2015. The current usage metrics is available 48-96 hours after online publication and is updated daily on week days.
Initial download of the metrics may take a while.