Fig. 5
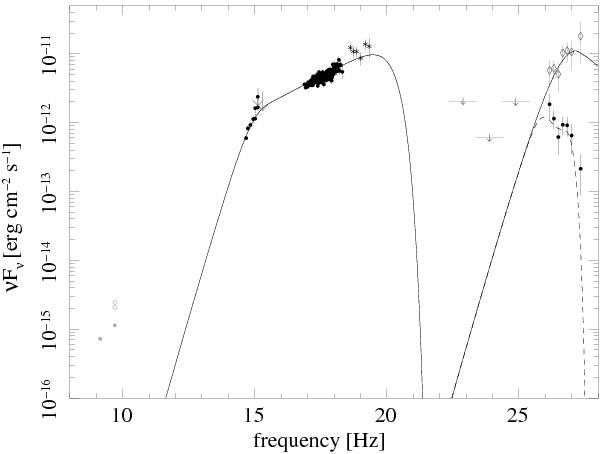
Spectral energy distribution of 1ES 0229+200 with simultaneous measured optical, UV, and X-ray fluxes, all corrected for host galaxy emission, Galactic extinction, and Galactic absorption is shown as black data points. The 58 months Swift/BAT spectrum is shown >10 keV (black crosses). In grey (filled and open circles), historical radio and UV data are shown and their origin is discussed in the text. The grey upper limits in the GeV energy range are taken from Dermer et al. (2011) and represent the upper limit in the energy bins 0.1−1GeV, 1−10GeV, and 10−100GeV by Fermi observations (Aug. 2008 to Sep. 2010). The VHE γ-ray spectrum measured by H.E.S.S. (black circles, taken from Aharonian et al. 2007), as well as the EBL corrected, intrinsic source spectrum (grey open diamonds) with a hard photon index, which implies an inverse Compton emission peaking at very high frequency (>1027Hz), is shown. The solid line represents an SSC model that can describe the intrinsic synchrotron and inverse Compton emission of 1ES 0229+200, and the dashed line represents the absorption by the EBL (details about these models are described in the text).
Current usage metrics show cumulative count of Article Views (full-text article views including HTML views, PDF and ePub downloads, according to the available data) and Abstracts Views on Vision4Press platform.
Data correspond to usage on the plateform after 2015. The current usage metrics is available 48-96 hours after online publication and is updated daily on week days.
Initial download of the metrics may take a while.