Fig. 4
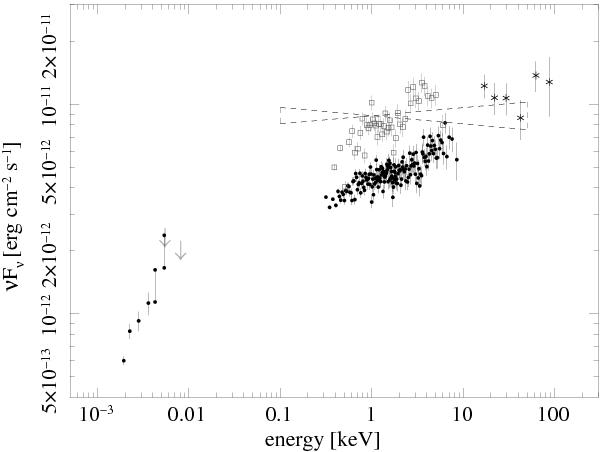
Synchrotron emission of 1ES 0229+200 with simultaneously measured optical, UV, and X-ray emission by ATOM and XMM-Newton of August 21, 2009 (black dots). The optical and UV emission is corrected for both the host galaxy and Galactic extinction, and the X-ray emission observed by XMM-Newton/MOS is corrected for the absorption. The bars in the UVW1 and UVM2 bands are explained in Sect. 5.1. The grey open squares represent the non-simultaneous Swift/XRT spectrum (corrected for detected absorption) with the highest flux in 2009. The Swift/BAT 58 month (Dec. 2004–Oct. 2009) spectrum is shown in the energy band >10 keV (black crosses). The dashed line (butterfly) represents the BeppoSAX spectrum from 2001 (Donato et al. 2005). The grey upper limits represent historical UV observations with GALEX that are extinction corrected and of origin discussed in the text.
Current usage metrics show cumulative count of Article Views (full-text article views including HTML views, PDF and ePub downloads, according to the available data) and Abstracts Views on Vision4Press platform.
Data correspond to usage on the plateform after 2015. The current usage metrics is available 48-96 hours after online publication and is updated daily on week days.
Initial download of the metrics may take a while.