Fig. 12
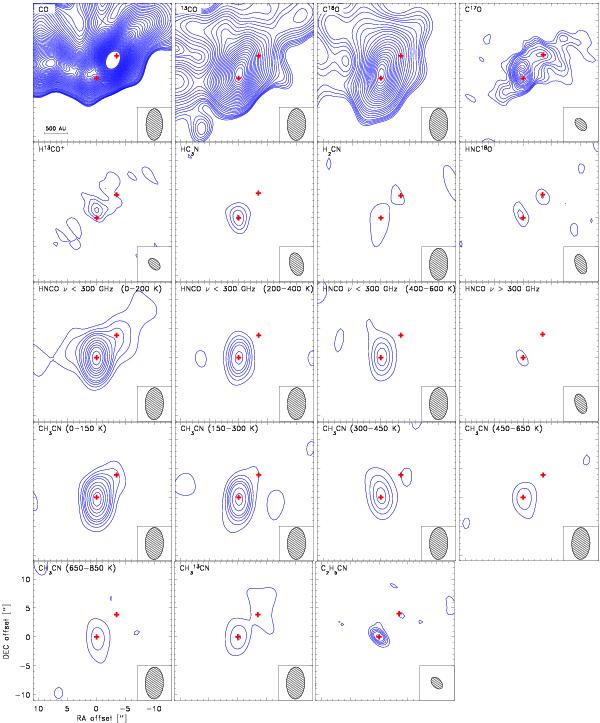
Emission for CO, HCO+ and the N-bearing organic molecules. For each molecule, except where noted otherwise, the emission has been integrated over all identified lines in one selected frequency band - isolated by at least 10 MHz from other species (see Table A.1 for specific lines). The integration is performed over the width of the “A” component (i.e., from 0 to 6 km s-1) and contours are shown in steps of 3σ to 15σ and in steps of 6σ thereafter, where σ is the rms noise level for the integrated line intensity; the rms per channel is given in Table 1. A scale-bar is shown in the upper left panel. The beam size at the frequency of the selected transitions for the given molecule is shown in the lower right corner of each panel.
Current usage metrics show cumulative count of Article Views (full-text article views including HTML views, PDF and ePub downloads, according to the available data) and Abstracts Views on Vision4Press platform.
Data correspond to usage on the plateform after 2015. The current usage metrics is available 48-96 hours after online publication and is updated daily on week days.
Initial download of the metrics may take a while.