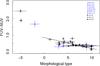
Fig. 7
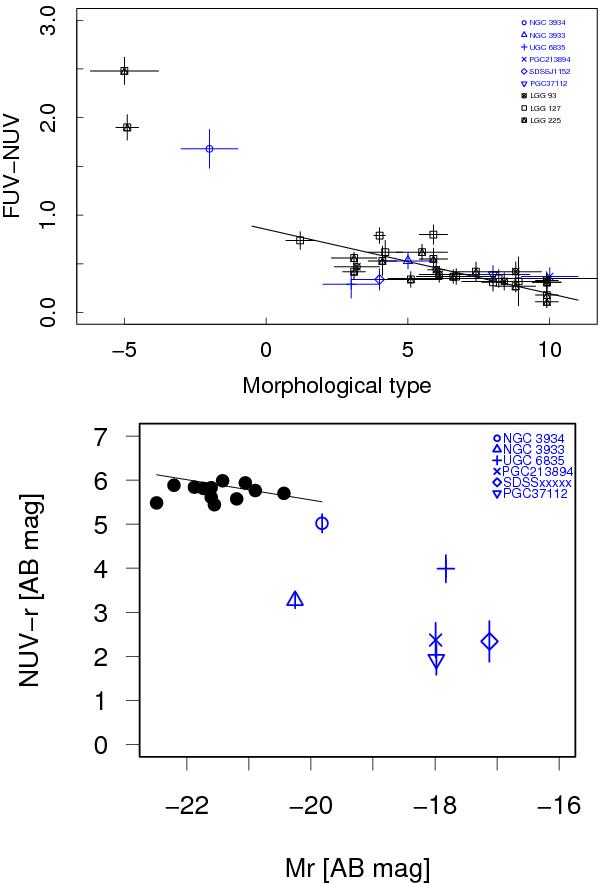
Top: (FUV – NUV) color as a function of the morphological type for the six group members of the NGC 3933 group. The solid line represents the best linear fit for types T = −0.5 or later (i.e. spiral galaxies and irregular) in Gil de Paz et al. (2007). Members of LGA groups from Marino et al. (2010) are plotted for comparison (see text). Bottom: NUV-r vs. Mr color–magnitude plot for galaxies in the NGC 3933 group. The Yi et al. (2005) red sequence is shown as a solid line. Early-type galaxies in Marino et al. (2011a) are indicated as black dots (see text).
Current usage metrics show cumulative count of Article Views (full-text article views including HTML views, PDF and ePub downloads, according to the available data) and Abstracts Views on Vision4Press platform.
Data correspond to usage on the plateform after 2015. The current usage metrics is available 48-96 hours after online publication and is updated daily on week days.
Initial download of the metrics may take a while.