Fig. 12
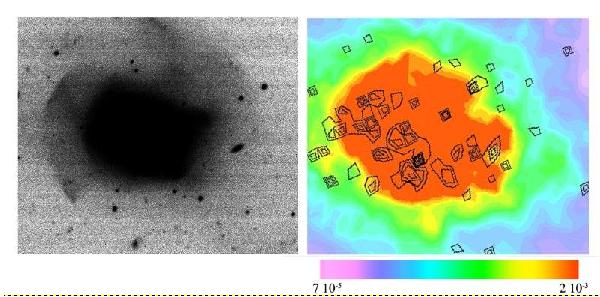
Deep R-band image of NGC 3934 (left) compared on the same scale with isodensity contours (right) from our simulation (see text). The simulated image includes twenty-six no-equispaced levels to emphasize the shells: seven equispaced levels from 7 × 10⁻⁵ to 1 × 10⁻⁴, eighteen equispaced levels from 1.5 × 10⁻⁴ to 1 × 10⁻³ and then the last level, 2 × 10⁻³ normalized to the total counts in the map. Black contours in the right panel correspond to star clusters 0.05 Gyr old or younger.
Current usage metrics show cumulative count of Article Views (full-text article views including HTML views, PDF and ePub downloads, according to the available data) and Abstracts Views on Vision4Press platform.
Data correspond to usage on the plateform after 2015. The current usage metrics is available 48-96 hours after online publication and is updated daily on week days.
Initial download of the metrics may take a while.