Fig. 11
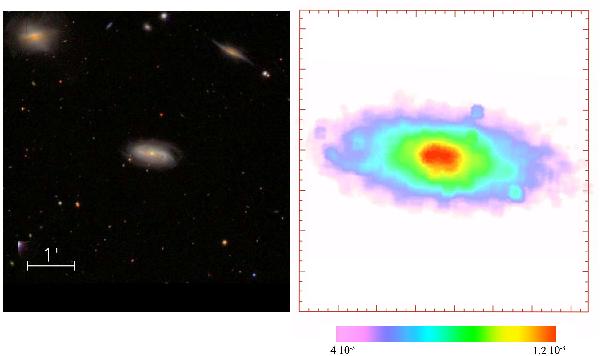
Color-composite SDSS image of NGC 3933 group (left) centered on the spiral galaxy NGC 3933 is compared on the same scale with the R-band map from our simulation (right); the map includes forty equi-spaced levels and a density contrast of three hundred normalized to the total flux in the map. Note that the observed galaxy (left panel) corresponds to the inner (red) region in the right panel.
Current usage metrics show cumulative count of Article Views (full-text article views including HTML views, PDF and ePub downloads, according to the available data) and Abstracts Views on Vision4Press platform.
Data correspond to usage on the plateform after 2015. The current usage metrics is available 48-96 hours after online publication and is updated daily on week days.
Initial download of the metrics may take a while.