Fig. 6
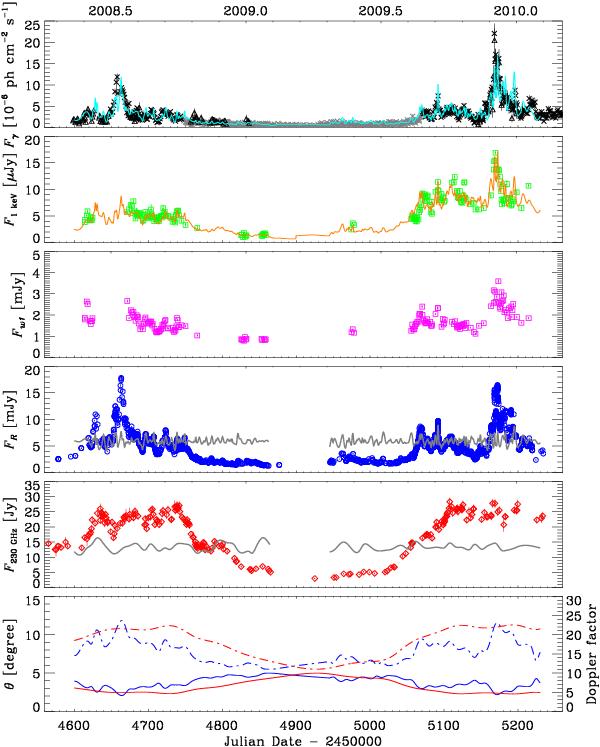
Light curves of 3C 454.3 from May 2008 to January 2010 at different frequencies. The γ-ray data are 0.1–300 GeV fluxes; black triangles are from AGILE (Vercellone et al. 2010; Pacciani et al. 2010) and crosses from Fermi (the black ones from Abdo et al. 2009; and Ackermann et al. 2010, and the grey ones from the public light curve of the LAT monitored sources). The 1 keV flux densities are derived from Swift-XRT spectra fitted with an absorbed power law with NH = 1.34 × 1021 cm-2 (see Sect. 5 and Table 3). De-reddened UV flux densities in the w1 band are obtained as explained in Sect. 3. The optical R-band dereddened flux densities are derived from GASP data (see Sect. 2). The mm light curve is from the SMA. The cyan and orange curves superposed on the γ- and X-ray light curves, respectively, are obtained by combining cubic spline interpolations through the 1-day binned optical and the 7-day binned mm light curves as explained in the text. The bottom panel displays the evolution of the Doppler factors (dot-dashed lines) affecting the optical (blue) and mm (red) fluxes, and the viewing angles of the corresponding emitting regions (solid lines). Grey lines superposed on the optical and mm light curves represent intrinsic flux variations as would be observed under a constant Doppler factor δ = 18.
Current usage metrics show cumulative count of Article Views (full-text article views including HTML views, PDF and ePub downloads, according to the available data) and Abstracts Views on Vision4Press platform.
Data correspond to usage on the plateform after 2015. The current usage metrics is available 48-96 hours after online publication and is updated daily on week days.
Initial download of the metrics may take a while.