Fig. 7
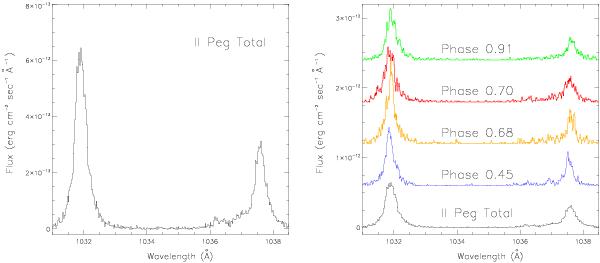
Sample FUSE spectra of II Peg containing the 1032 and 1038 Å transitions of O vi. The left-hand panel shows the total II Peg FUSE spectrum (1032/1038 intensity ratio = 2.03 ± 0.07), while selected orbital phases are given on the right. Phases are offset by 6 × 10-13 erg cm-2 s-1 for ease of presentation. (This figure is available in color in electronic form.)
Current usage metrics show cumulative count of Article Views (full-text article views including HTML views, PDF and ePub downloads, according to the available data) and Abstracts Views on Vision4Press platform.
Data correspond to usage on the plateform after 2015. The current usage metrics is available 48-96 hours after online publication and is updated daily on week days.
Initial download of the metrics may take a while.