Free Access
Fig. 6
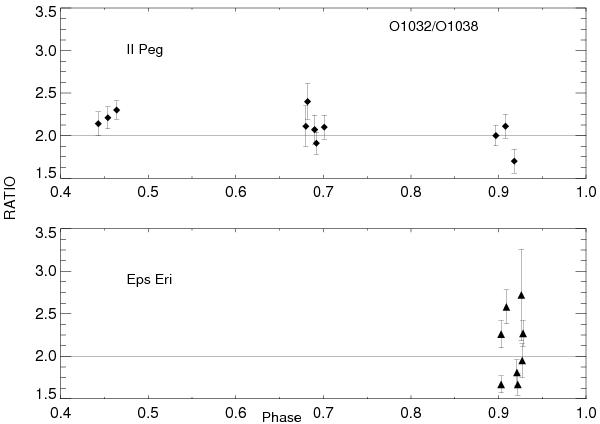
Sample FUSE 1032/1038 line ratios in O vi plotted as a function of orbital phase. Spectra are in time order as compared to the first part of the ϵ Eri light curve and the total II Peg light curves.
Current usage metrics show cumulative count of Article Views (full-text article views including HTML views, PDF and ePub downloads, according to the available data) and Abstracts Views on Vision4Press platform.
Data correspond to usage on the plateform after 2015. The current usage metrics is available 48-96 hours after online publication and is updated daily on week days.
Initial download of the metrics may take a while.