Fig. 1
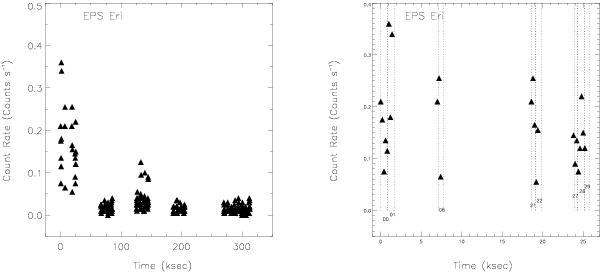
Light curves for ϵ Eri over the entire time period of the FUSE observations. The left-hand panel show the O vi light curve (1032 + 1038 Å lines) and the right-hand one an expanded view of the first 25 ks, which has the greatest level of stellar activity. Labels for phases 00 to 29, for intervals that had non-zero exposure of good signal-to-noise, are given and correspond to the Specnum names in the last column of Table 2; i.e., phase 02 did not have sufficient signal and is not in Table 2. The bin size is 200 s for both light curves. Spectral bins are indicated by the dashed vertical lines.
Current usage metrics show cumulative count of Article Views (full-text article views including HTML views, PDF and ePub downloads, according to the available data) and Abstracts Views on Vision4Press platform.
Data correspond to usage on the plateform after 2015. The current usage metrics is available 48-96 hours after online publication and is updated daily on week days.
Initial download of the metrics may take a while.