Free Access
Fig. 4
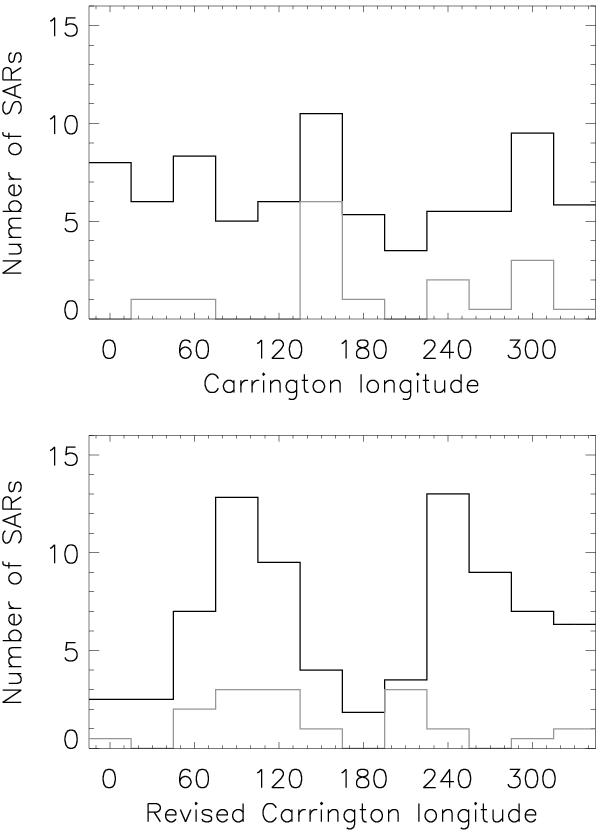
The normalized number distribution of SARs in the Carrington frame (upper panel) and in the new dynamic reference frame (lower panel) during solar cycles 19–23 in the northern hemisphere. The black lines denote all the SARs and the gray lines denote the SARs selected by ourselves.
Current usage metrics show cumulative count of Article Views (full-text article views including HTML views, PDF and ePub downloads, according to the available data) and Abstracts Views on Vision4Press platform.
Data correspond to usage on the plateform after 2015. The current usage metrics is available 48-96 hours after online publication and is updated daily on week days.
Initial download of the metrics may take a while.