Fig. 2
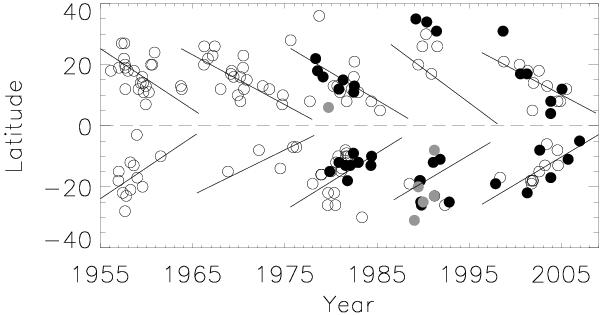
The latitudinal distribution of SARs for the northern (positive latitude) and southern (negative latitude) hemispheres in solar cycles 19–23. Black-filled circles denote the SARs selected both by other authors and by ourselves, open circles denote the SARs selected only by other authors, gray-filled circles denote the SARs selected only by ourselves, and the lines denote the mean latitude of sunspots.
Current usage metrics show cumulative count of Article Views (full-text article views including HTML views, PDF and ePub downloads, according to the available data) and Abstracts Views on Vision4Press platform.
Data correspond to usage on the plateform after 2015. The current usage metrics is available 48-96 hours after online publication and is updated daily on week days.
Initial download of the metrics may take a while.