Fig. 5
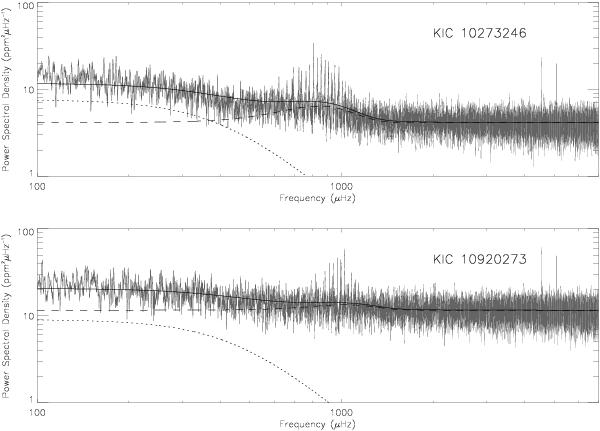
Power density spectra – smoothed over 1μHz in order to enhance p-mode visibility – of KIC 10273246 (top panel) and KIC 10920273 (bottom panel), plotted on a log-log scale. The solid black lines represent the fits described in the text. The remaining lines represent different components of the fitting model: the power envelope due to oscillations added to the offset from white noise (dashed), and granulation (dotted).
Current usage metrics show cumulative count of Article Views (full-text article views including HTML views, PDF and ePub downloads, according to the available data) and Abstracts Views on Vision4Press platform.
Data correspond to usage on the plateform after 2015. The current usage metrics is available 48-96 hours after online publication and is updated daily on week days.
Initial download of the metrics may take a while.