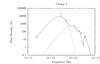
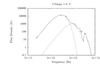
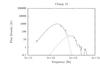
Fig. 12
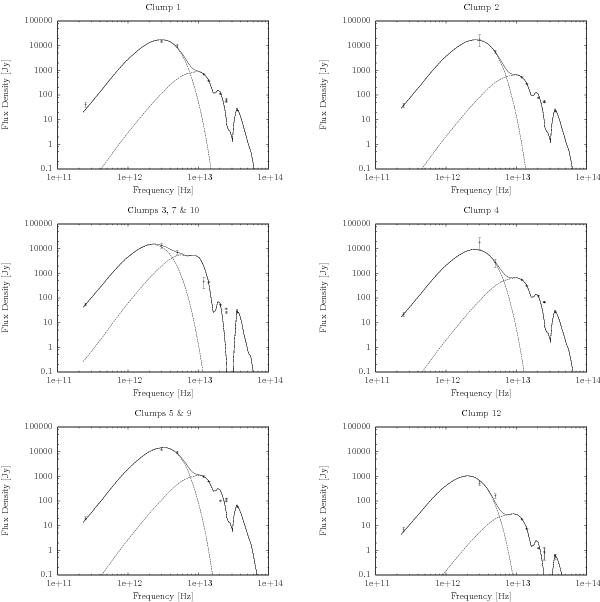
The SEDs of massive-star forming regions associated with massive clumps detected in 1.2 mm continuum emission; top labels show names of the clumps. Dots with error bars are flux densities estimated from SIMBA, IRAS, and MSX observations. Each SED is modeled with two dust components at different temperatures (physical parameters for each model are in Table 4); drawn lines are the total flux density of the two dust components, and dashed lines are the contributions of each dust component.
Current usage metrics show cumulative count of Article Views (full-text article views including HTML views, PDF and ePub downloads, according to the available data) and Abstracts Views on Vision4Press platform.
Data correspond to usage on the plateform after 2015. The current usage metrics is available 48-96 hours after online publication and is updated daily on week days.
Initial download of the metrics may take a while.