Fig. 16
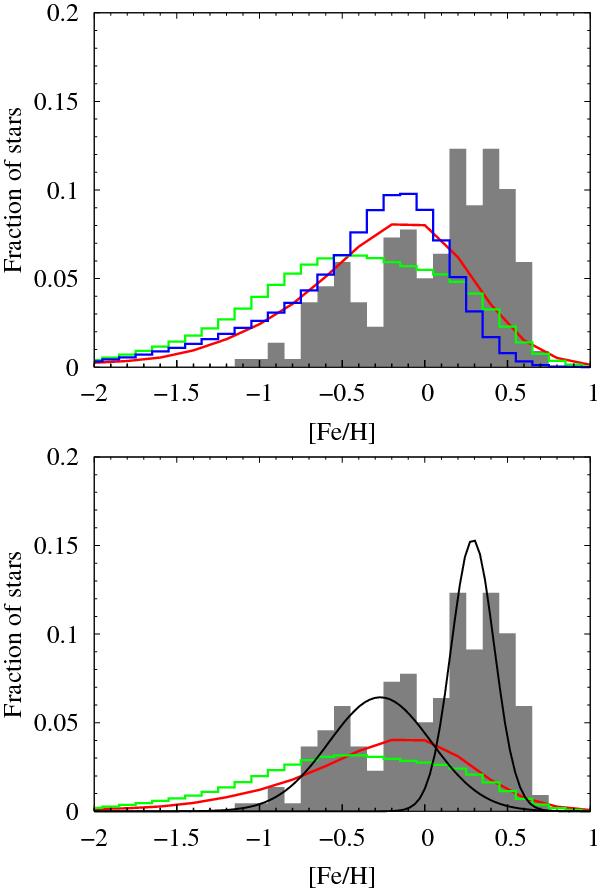
Upper panel: comparison between the bulge MD predicted by the chemical model of Ballero et al. (2007b) (red line) and by the model of Immeli et al. (2004) (green line for the model B and blue line for the model F ) with the observed MD (shaded histogram). The three model MDs have been convolved with observational errors. Lower panel: the previous model MDs were normalised to 50% and compared to the MD of the two subpopulations A and B (each of them corresponding to 50% of the total) illustrated here by two Gaussians with position and dispersion according to Table 5.
Current usage metrics show cumulative count of Article Views (full-text article views including HTML views, PDF and ePub downloads, according to the available data) and Abstracts Views on Vision4Press platform.
Data correspond to usage on the plateform after 2015. The current usage metrics is available 48-96 hours after online publication and is updated daily on week days.
Initial download of the metrics may take a while.