Fig. 1
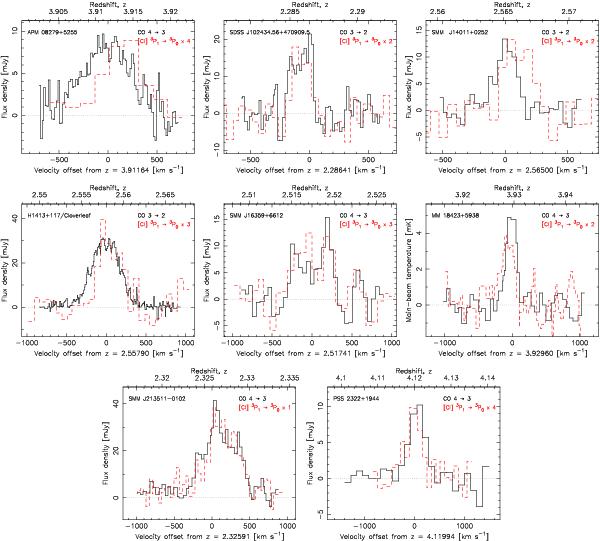
The [C i]  spectra (broken lines) overlaid on the CO rotational transition used (full lines) for the published high redshift [C i] detections, where the [C i] intensity is scaled by the value shown in the legend. All spectra are shown at the original spectral resolution and have been re-sampled to the reference frequency of the CO transition (νref in Table 1, thus showing the offset from this), except in the case of SMM J213511–0102 (the subject of a spectral scan), where both spectra are shown relative to the derived CO 1 → 0 redshift of z = 2.32591 (Danielson et al. 2011). Note that, for the sake of clarity, the spectra for MM 18423+5938 have been truncated from the full ± 2400 km s-1 range (Lestrade et al. 2010).
Current usage metrics show cumulative count of Article Views (full-text article views including HTML views, PDF and ePub downloads, according to the available data) and Abstracts Views on Vision4Press platform.
Data correspond to usage on the plateform after 2015. The current usage metrics is available 48-96 hours after online publication and is updated daily on week days.
Initial download of the metrics may take a while.