Fig. 6
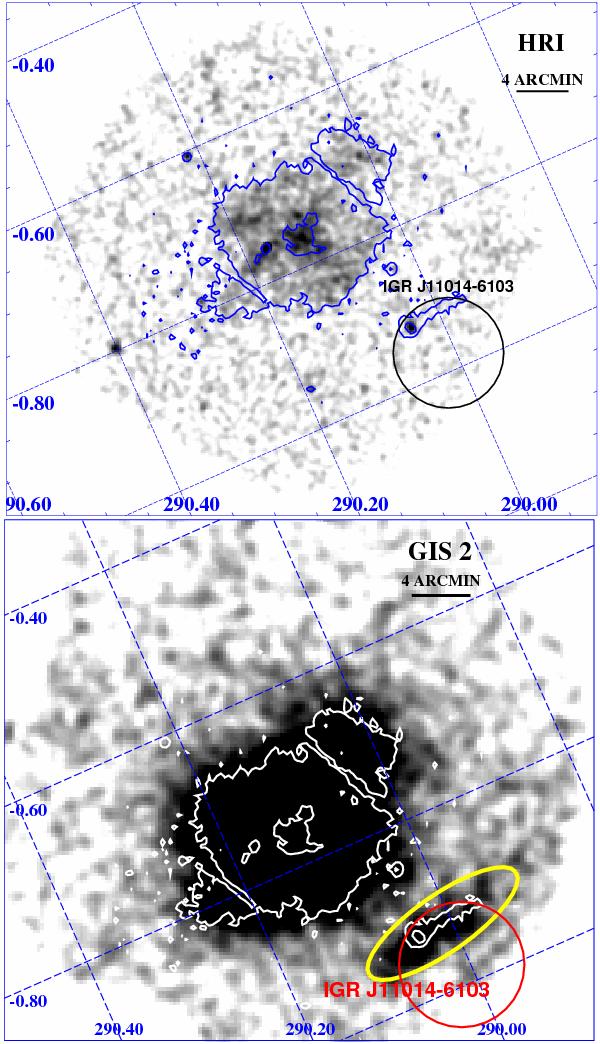
Top: ROSAT /HRI FoV around IGR J11014-6103 (observation ID. RH500445A01). The image is in the 0.2–2.4 keV energy band with a resolution of 5″ (see Sect. 2.3). We overplot on this image the XMM-Newton contour levels (in blue) determined from the EPIC-MOS1 data in observation ID. 0152570101 (see also Fig. 1). The black circle represents the INTEGRAL position of IGR J11014-6103. The bright extended emission in the center of the FoV is SNR MSH 11-61A. Bottom: ASCA /GIS2 FoV around IGR J11014-6103 (observation ID. 51021000). The image is in the 0.5–10 keV energy band. Extended emission is clearly visible on the bottom right side of the detector, below SNR MSH 11-61A. We overplot on this image the XMM-Newton contours (in white), the INTEGRAL error circle of IGR J11014-6103 (red circle), and the extraction region adopted for the GIS spectral analysis (yellow ellipse).
Current usage metrics show cumulative count of Article Views (full-text article views including HTML views, PDF and ePub downloads, according to the available data) and Abstracts Views on Vision4Press platform.
Data correspond to usage on the plateform after 2015. The current usage metrics is available 48-96 hours after online publication and is updated daily on week days.
Initial download of the metrics may take a while.