Fig. 3
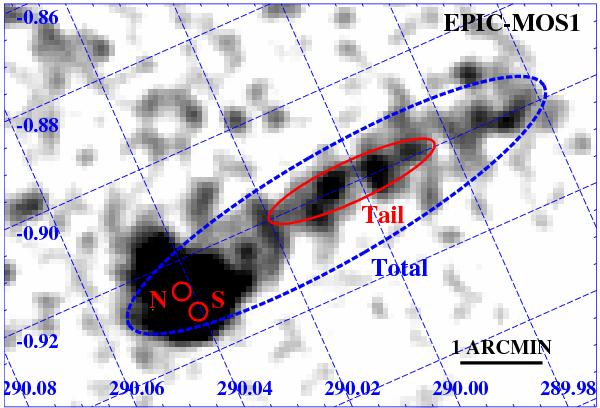
Zoom of the EPIC-MOS1 FoV around IGR J11014-6103 during observation ID. 0152570101 (0.2–12 keV). The regions used for the extraction of the spectra of sources N and S are indicated with red small circles; the region used for the spectral analysis of the tail with a red ellipse. We also show the extraction region used to perform the spectral analysis of the entire emitting region (dashed ellipse; see Sect. 2.2).
Current usage metrics show cumulative count of Article Views (full-text article views including HTML views, PDF and ePub downloads, according to the available data) and Abstracts Views on Vision4Press platform.
Data correspond to usage on the plateform after 2015. The current usage metrics is available 48-96 hours after online publication and is updated daily on week days.
Initial download of the metrics may take a while.