Fig. 7
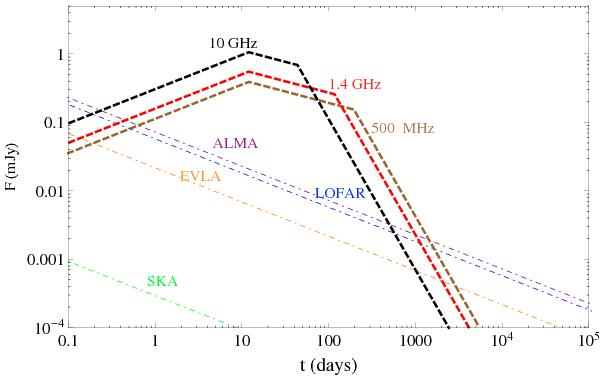
The theoretical light curve of radio afterglow of a typical Pop III.2 GRB at
z ~ 10. We show the evolution of afterglow flux
F(mJy) as a function of time t (days) for
typical parameters: isotropic kinetic energy
Eiso = 1054 erg, electron spectral index
p = 2.5, plasma parameters ϵe = 0.1,
ϵB = 0.01, initial Lorentz factor
γd = 200, interstellar medium density
n = 1 cm-3, for the range of frequencies: 500 MHz
(dashed brown line), 1.4 GHz (dashed red line), 10 GHz (dashed black line), in
comparison with flux sensitivity  as a
function of integration time, tint(days) for SKA
(dot-dashed green line), EVLA (dot-dashed orange line), LOFAR (dot-dashed blue line)
and ALMA (dot-dashed purple line).
as a
function of integration time, tint(days) for SKA
(dot-dashed green line), EVLA (dot-dashed orange line), LOFAR (dot-dashed blue line)
and ALMA (dot-dashed purple line).
Current usage metrics show cumulative count of Article Views (full-text article views including HTML views, PDF and ePub downloads, according to the available data) and Abstracts Views on Vision4Press platform.
Data correspond to usage on the plateform after 2015. The current usage metrics is available 48-96 hours after online publication and is updated daily on week days.
Initial download of the metrics may take a while.