Fig. 5
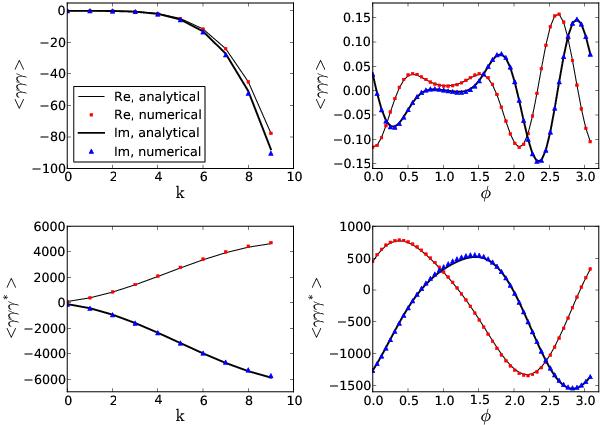
Comparison of numerically evaluated ⟨ γγγ ⟩ (x,y) and ⟨ γγγ∗ ⟩ (x,y) with their analytical toy models described in this section adopting α = 0.05. “Re” and “Im” indicate the real and imaginary parts of the shear correlation functions. Left panels: the functions are evaluated at x = 0.25k e−iπ/3 and y = 0.17k eiπ/8 for different values of k; right panels: the functions are evaluated at x = 0.75 e−iπ/3 and y = 0.45 eiφ for 50 equally spaced φ values.
Current usage metrics show cumulative count of Article Views (full-text article views including HTML views, PDF and ePub downloads, according to the available data) and Abstracts Views on Vision4Press platform.
Data correspond to usage on the plateform after 2015. The current usage metrics is available 48-96 hours after online publication and is updated daily on week days.
Initial download of the metrics may take a while.