Free Access
Fig. 2
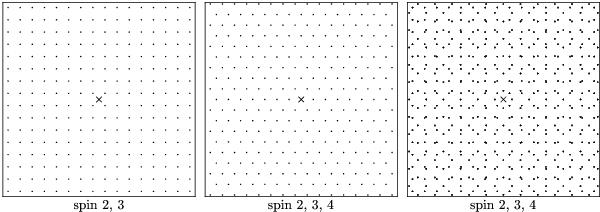
Examples of sampling grids applicable for 2D integration over singular kernels of different spin values. The cross in the center indicates the position of the singularity in the integration kernel.
Current usage metrics show cumulative count of Article Views (full-text article views including HTML views, PDF and ePub downloads, according to the available data) and Abstracts Views on Vision4Press platform.
Data correspond to usage on the plateform after 2015. The current usage metrics is available 48-96 hours after online publication and is updated daily on week days.
Initial download of the metrics may take a while.