Fig. 9
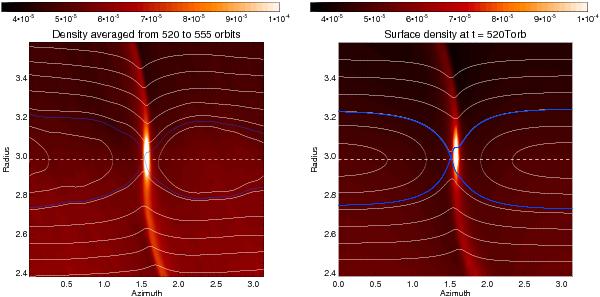
Left: contours of the midplane density obtained in Model 1 with the NIRVANA run, and time-averaged between 520 and 555 orbits. Streamlines in the disc midplane, time-averaged over the same time interval, are overplotted by solid curves. Right: gas surface density obtained at 520 orbits with disc Model 1 in the FARGO viscous run, with instantaneous streamlines overplotted. In both panels, the horizontal dashed line shows the planet’s corotation radius, defined as the location Rc where Ω(Rc) = Ωp.
Current usage metrics show cumulative count of Article Views (full-text article views including HTML views, PDF and ePub downloads, according to the available data) and Abstracts Views on Vision4Press platform.
Data correspond to usage on the plateform after 2015. The current usage metrics is available 48-96 hours after online publication and is updated daily on week days.
Initial download of the metrics may take a while.