Fig. 3
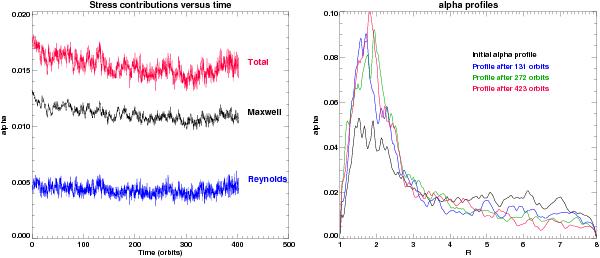
Left: volume-averaged alpha values for the disc model with an inner cavity, shown from the point in time when the planet is inserted in the disc. As in all other panels, time is expressed in orbital periods at R = 3 (the planet’s fixed location). Right: azimuthally- and vertically-averaged profiles of alpha for the same disc model, shown at different times after the planet inclusion.
Current usage metrics show cumulative count of Article Views (full-text article views including HTML views, PDF and ePub downloads, according to the available data) and Abstracts Views on Vision4Press platform.
Data correspond to usage on the plateform after 2015. The current usage metrics is available 48-96 hours after online publication and is updated daily on week days.
Initial download of the metrics may take a while.