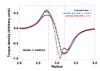
Fig. 13
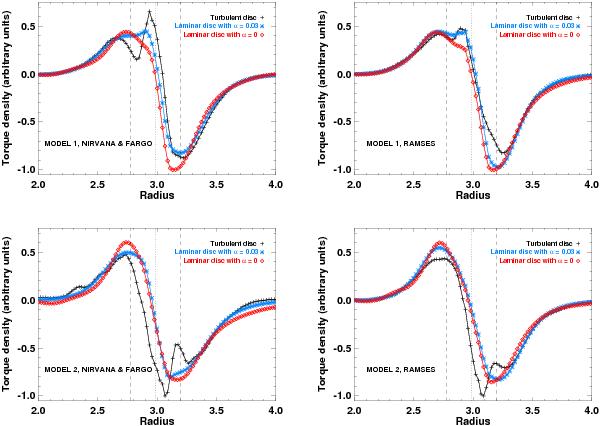
Time average of the torque density distribution, obtained with Model 1 (top row, plus signs) and Model 2 (bottom row, plus signs). For comparison, the torque density distribution of the inviscid and viscous non-magnetic disc models are overplotted (diamond and star symbols, respectively). The torque profiles of the turbulent runs have been time-averaged over 100 orbits. In each panel, torque density profiles are divided by the maximum of the (absolute value of the) inviscid, viscous, and turbulent torque profiles. In x-axis, orbital separation is depicted from R = 2 to R = 4, which corresponds to a radial extent ≃±3Hp about the planet location. In each panel, the dashed lines show the approximate location of the separatrices of the planet’s horseshoe region, and the dotted line that of the planet’s corotation radius.
Current usage metrics show cumulative count of Article Views (full-text article views including HTML views, PDF and ePub downloads, according to the available data) and Abstracts Views on Vision4Press platform.
Data correspond to usage on the plateform after 2015. The current usage metrics is available 48-96 hours after online publication and is updated daily on week days.
Initial download of the metrics may take a while.