Fig. 12
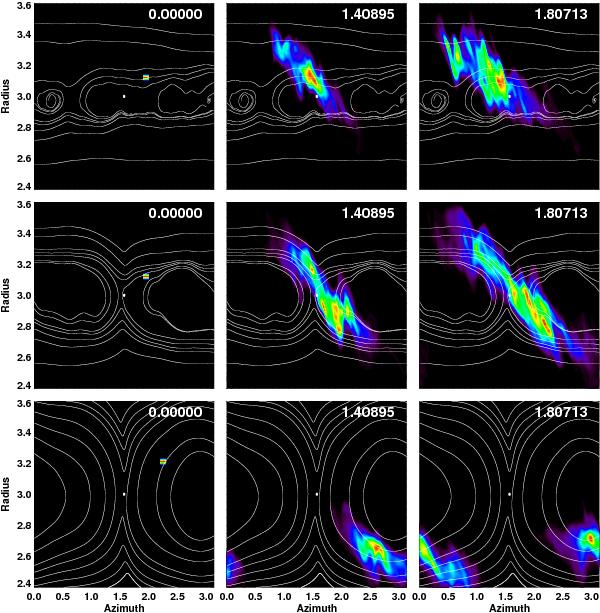
Evolution of the concentration of the passive contaminant, C(R,ϕ), defined in the text, with superimposed averaged streamlines in the midplane for disc models with parameters equal to those of Model 1. The contour levels are defined for each panel separately to highlight the region occupied by the contaminant at each time. The upper three panels are for a disc with no embedded planet. The middle three panels have an embedded planet with Mp = 3 × 10⁻⁴ M⋆. The lower panels are for an embedded planet with Mp = 10-3 M⋆. Times are given in units of the planet orbital period. Results are obtained with NIRVANA.
Current usage metrics show cumulative count of Article Views (full-text article views including HTML views, PDF and ePub downloads, according to the available data) and Abstracts Views on Vision4Press platform.
Data correspond to usage on the plateform after 2015. The current usage metrics is available 48-96 hours after online publication and is updated daily on week days.
Initial download of the metrics may take a while.