Fig. 10
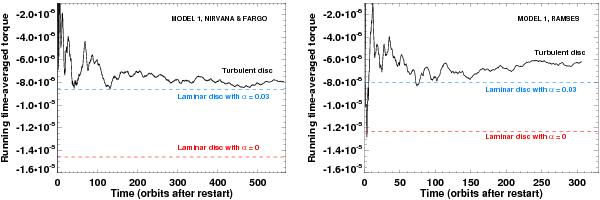
Running time-averaged specific torque obtained with Model 1, for the NIRVANA run (left panel), and the RAMSES run (right panel). For comparison, the final value of the time-averaged torques obtained from 2D laminar disc models are overplotted, wherein the initial density profile is the time-averaged density profile obtained with the MHD run. Note that in the left panel, the turbulent run with NIRVANA is compared to laminar runs carried out with FARGO. Two series of laminar disc models have been performed, one with an inviscid disc (αp = 0), and one with a viscous disc (corresponding to αp = 0.03).
Current usage metrics show cumulative count of Article Views (full-text article views including HTML views, PDF and ePub downloads, according to the available data) and Abstracts Views on Vision4Press platform.
Data correspond to usage on the plateform after 2015. The current usage metrics is available 48-96 hours after online publication and is updated daily on week days.
Initial download of the metrics may take a while.