Fig. 3
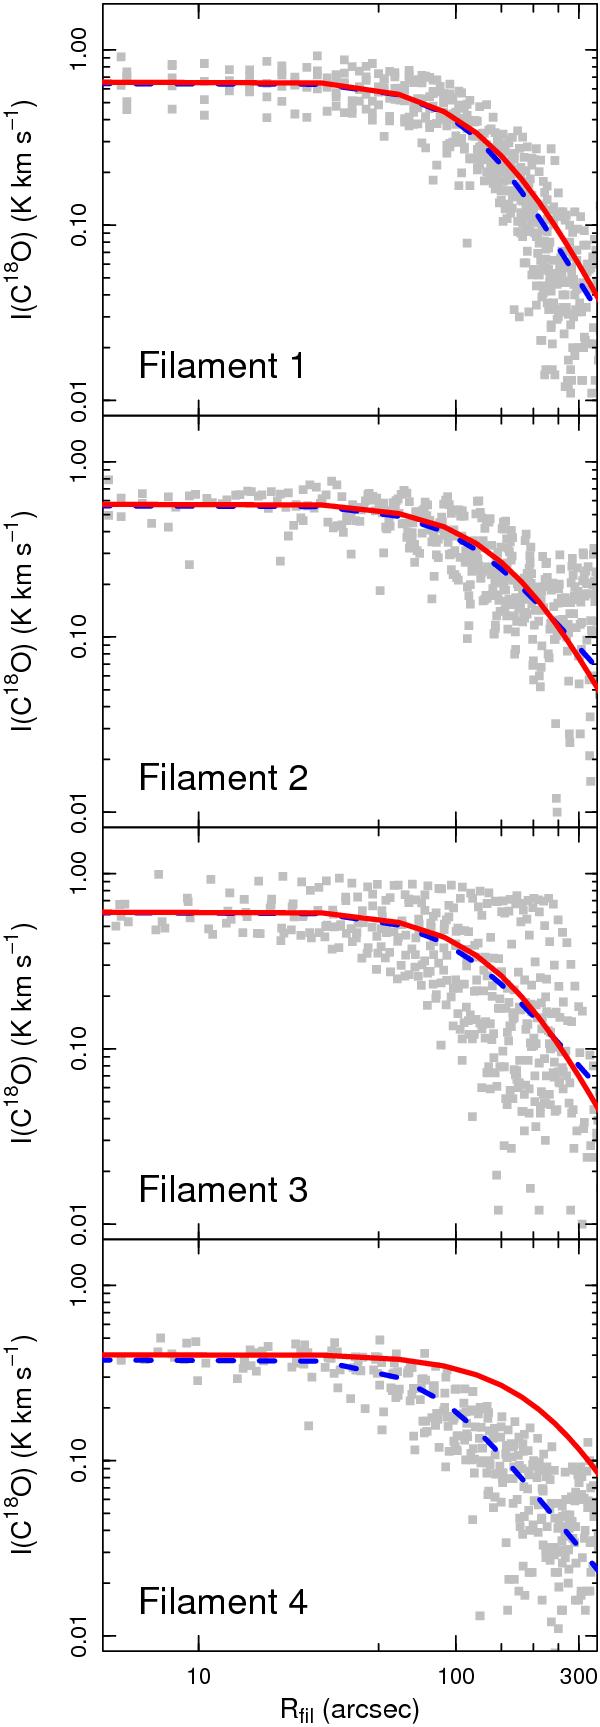
C18O(1–0) emission profiles across each of the L1517 filaments. The points represent the integrated emission within the velocity range of each filament (see Table 1), and Rfil is the distance to the filament axis. For each filament, the red solid curve indicates the isothermal cylinder model that fits the emission towards the axis, and the blue dashed line is the best-fit softened power law.
Current usage metrics show cumulative count of Article Views (full-text article views including HTML views, PDF and ePub downloads, according to the available data) and Abstracts Views on Vision4Press platform.
Data correspond to usage on the plateform after 2015. The current usage metrics is available 48-96 hours after online publication and is updated daily on week days.
Initial download of the metrics may take a while.