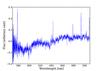
Fig. 2
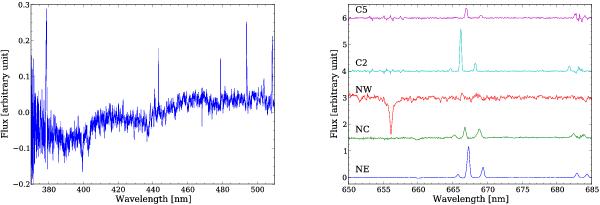
Left: blue part of the spectrum of the NE clump. Several lines are clearly detected: [OII] 372.7, Hγ, [OIII] 436.3, Hβ, [OIII] 495.9, and [OIII] 500.7. Unfortunately the blue spectrum for other clumps is not deep enough to detect these emission lines. Right: spectra of clumps NE, NC, NW, C2, and C5. The spectra have been offset to distinguish them more easily. The spectra of clumps NC, NW, C2, and C5 are multiplied by 5 as they are intrinsically much fainter than the spectrum of NE. Except for NW, several lines are clearly detected: [NII] 654.8, Hα, [NII] 658.4, [SII] 671.7, and [SII] 673.1. The spectrum of NW shows a broad Hα line in absorption at almost 0-velocity with a weak Hα emission line at the recession velocity of Arp 158.
Current usage metrics show cumulative count of Article Views (full-text article views including HTML views, PDF and ePub downloads, according to the available data) and Abstracts Views on Vision4Press platform.
Data correspond to usage on the plateform after 2015. The current usage metrics is available 48-96 hours after online publication and is updated daily on week days.
Initial download of the metrics may take a while.