Fig. 7
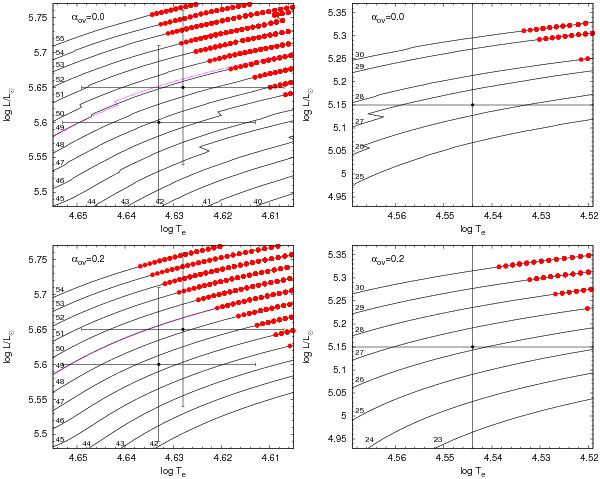
Evolutionary tracks relevant for our three stars. The models in the bottom figures include overshooting, the ones at the top do not. Left: tracks of 40 to 55 M⊙ computed with a mass-loss rate of 6.0 × 10⁻⁸ M⊙ yr-1. The error boxes of HD 46223 (the hotter star) and HD 46150 (the cooler star) are also displayed. To show that both stars can be modelled by the same mass-loss rate without affecting the excited frequency domain, we also plot a 49 M⊙ track computed with Ṁ = 6.8 × 10⁻⁸ M⊙ yr-1 (magenta-coloured line). Right: same, but for HD 46966 computed with a mass-loss rate of 5.0 × 10⁻⁹M⊙ yr-1. The full circles indicate positions along the tracks that have excited frequencies.
Current usage metrics show cumulative count of Article Views (full-text article views including HTML views, PDF and ePub downloads, according to the available data) and Abstracts Views on Vision4Press platform.
Data correspond to usage on the plateform after 2015. The current usage metrics is available 48-96 hours after online publication and is updated daily on week days.
Initial download of the metrics may take a while.