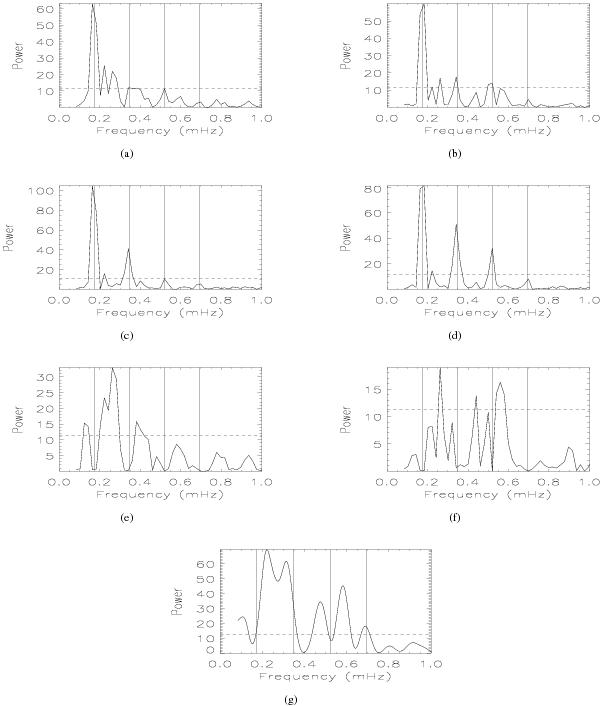
Fig. 4

a), b) Power spectra of the time series (1998-07-03 00:47–09:00 UT) of a macro-pixel (3 × 3 pixels) situated along the mid-way of the slit (Fig. 1b in EUV 171 Å (left) and 195 Å (right). c), d) The corresponding spectra of an enlarged macro-pixel (20 × 20 pixels). e), f) The power spectra after filtering out the orbital frequencies. g) The power spectrum of NoRH 17 GHz radio emission, (1998-07-03 02:55–06:30 UT). The vertical dot-dot-dashed lines are the orbital frequency and its higher harmonics. A horizontal dashed line indicates the 99% confidence level in all the panels (see Sect. 2.4). The detected peaks in all the bandpasses are summarised in Table 1.
Current usage metrics show cumulative count of Article Views (full-text article views including HTML views, PDF and ePub downloads, according to the available data) and Abstracts Views on Vision4Press platform.
Data correspond to usage on the plateform after 2015. The current usage metrics is available 48-96 hours after online publication and is updated daily on week days.
Initial download of the metrics may take a while.


