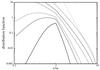
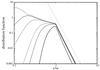
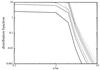
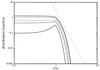
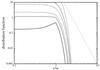
Fig. 3
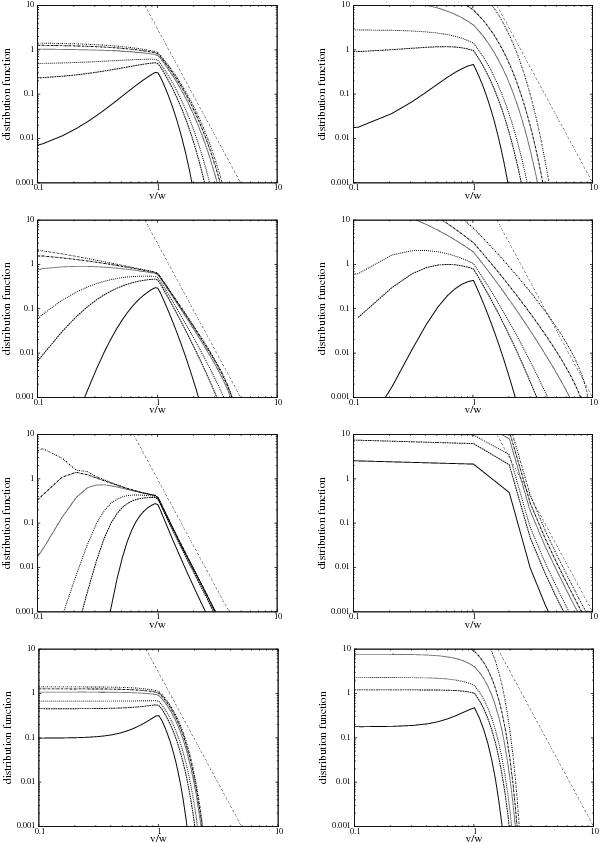
The normalized distributions vs. normalized speed (as in Fig. 1) for four different diffusion coefficients. From the top to the bottom row: D ~ vγ−1, D ~ v2, D ~ v4, and D ~ 1/v. The left column is for adiabatic cooling, the right for magnetically induced energy changes. In each panel the dashed straight line indicates the slope of v-5.
Current usage metrics show cumulative count of Article Views (full-text article views including HTML views, PDF and ePub downloads, according to the available data) and Abstracts Views on Vision4Press platform.
Data correspond to usage on the plateform after 2015. The current usage metrics is available 48-96 hours after online publication and is updated daily on week days.
Initial download of the metrics may take a while.