Fig. 4
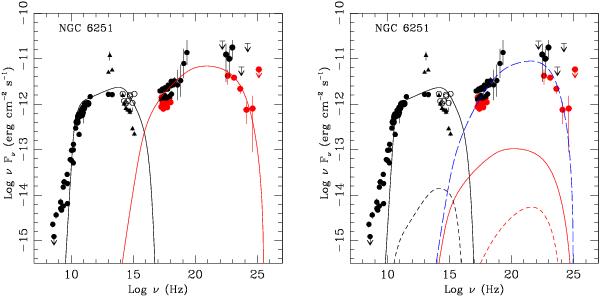
Nuclear broadband SED of NGC 6251 compiled using multi-epoch data. Radio to optical-UV data are reported in Table 4. Solid black triangles are the total IR flux. The solid IR points are the extrapolated non-thermal synchrotron fluxes given in Leipski et al. (2009). Empty optical-UV data are dereddened (see text). X-ray emission is presented in Sect. 3.2: black dots are for XMM-Netwon data and red from Swift satellite. Black γ-ray points correspond to EGRET flux (Mukherjee et al. 2002). Red γ-ray points are Fermi data (Abdo et al. 2010c). Left panel: the SED is modeled with a one-zone SSC model (solid black line: synchrotron curve, solid red line: IC emission). Right panel: the SED is modeled with the spine-layer model illustrated in Ghisellini et al. (2005). Solid black and red lines reproduce the SSC emission of the layer. Dashed black and red curves are the SSC model for the spine. The long-dashed blue line is the IC emission of the spine synchrotron photons scattered by the layer relativistic electrons.
Current usage metrics show cumulative count of Article Views (full-text article views including HTML views, PDF and ePub downloads, according to the available data) and Abstracts Views on Vision4Press platform.
Data correspond to usage on the plateform after 2015. The current usage metrics is available 48-96 hours after online publication and is updated daily on week days.
Initial download of the metrics may take a while.