Fig. 9
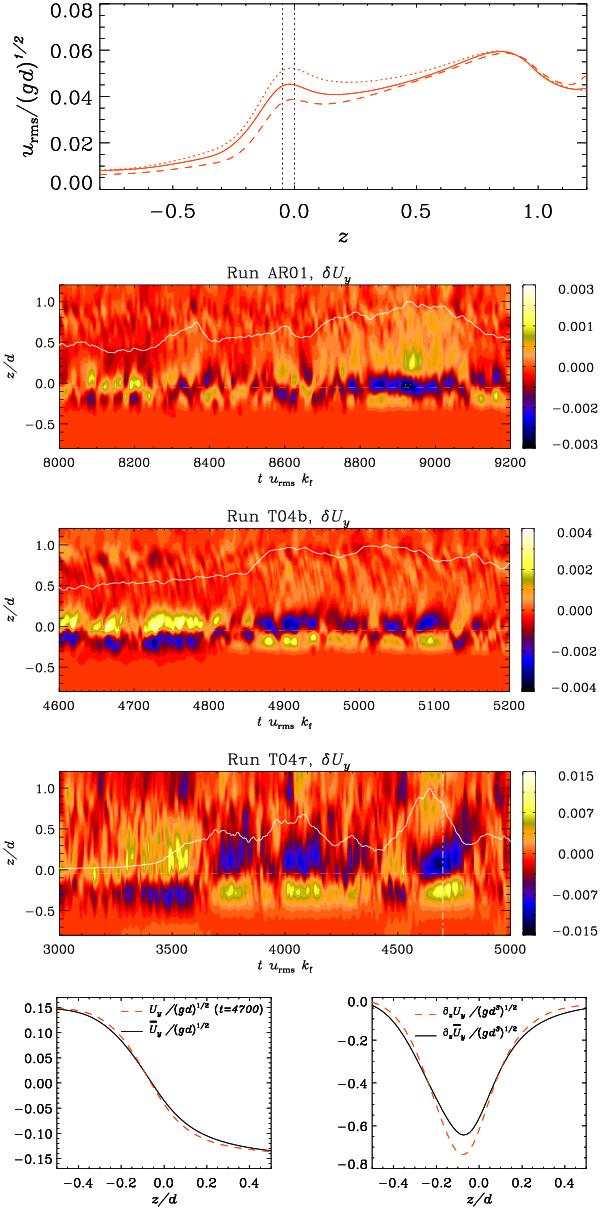
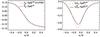
Top: time averaged vertical profile of
urms in the kinematic (dotted line) and saturated
(solid line) stages for the Runs T04b. The dashed line shows the deviation from the
average at a one of the peaks in the magnetic field amplitude. The three
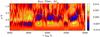
middle panels are butterfly diagrams of the angular velocity deviation,
 , for the
Runs AR01, T04b and T04τ. The continuous white lines in these
panels indicate the time evolution of Brms normalized to
its maximum value in the time interval. The bottom panels show
time-averaged (solid black lines) and instantaneous (dashed red lines, referring to
the white dash-dotted line in the bottom contour plot) values
of Uy
and ∂zUy.
, for the
Runs AR01, T04b and T04τ. The continuous white lines in these
panels indicate the time evolution of Brms normalized to
its maximum value in the time interval. The bottom panels show
time-averaged (solid black lines) and instantaneous (dashed red lines, referring to
the white dash-dotted line in the bottom contour plot) values
of Uy
and ∂zUy.
Current usage metrics show cumulative count of Article Views (full-text article views including HTML views, PDF and ePub downloads, according to the available data) and Abstracts Views on Vision4Press platform.
Data correspond to usage on the plateform after 2015. The current usage metrics is available 48-96 hours after online publication and is updated daily on week days.
Initial download of the metrics may take a while.