Fig. 8
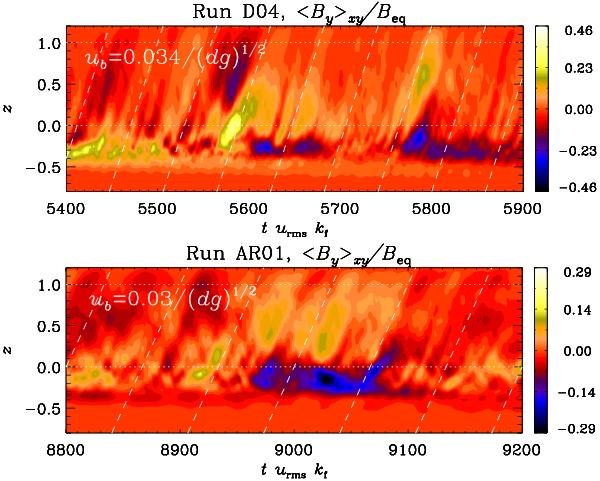
Butterfly diagram in the depth-time plane for the horizontally averaged toroidal magnetic field, By for Runs D04 and AR01. The dotted lines corresponds to the top (z = d) and base (z = 0) of the convection zone. The tilted dashed lines show approximate trajectories of buoyant magnetic fields. A rough estimate of rise speed is computed from these lines as indicated. The event at turmskf = 9020 in the bottom panel is also shown in the top panels of Fig. 7.
Current usage metrics show cumulative count of Article Views (full-text article views including HTML views, PDF and ePub downloads, according to the available data) and Abstracts Views on Vision4Press platform.
Data correspond to usage on the plateform after 2015. The current usage metrics is available 48-96 hours after online publication and is updated daily on week days.
Initial download of the metrics may take a while.