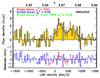
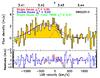
Fig.1

CO(4–3) spectrum of the CO emission in the brightest pixel of the central source in SW022550 (left panel) and SW022513 (right panel). The LSR velocity scale is relative to z = 3.866 for SW022550, and z = 3.427 for SW022513. The lines represent the best-fits obtained with a single Gaussian (red solid line), and with a double Gaussian (each component is shown with a dotted blue line and the sum with a solid blue line). The green dashed line represents a single Gaussian fit with FWHM equal to the best-fit value obtained for the other source, i.e., FWHM=800kms-1 in SW022513 and FWHM=1020kms-1 in SW022550. The best-fit parameters are listed in Table 1 and the reduced-χ2 are annotated on the upper left corner. The residuals obtained from the single and the double Gaussian component fits are shown in the bottom panels with a solid red and blue line, respectively.
Current usage metrics show cumulative count of Article Views (full-text article views including HTML views, PDF and ePub downloads, according to the available data) and Abstracts Views on Vision4Press platform.
Data correspond to usage on the plateform after 2015. The current usage metrics is available 48-96 hours after online publication and is updated daily on week days.
Initial download of the metrics may take a while.